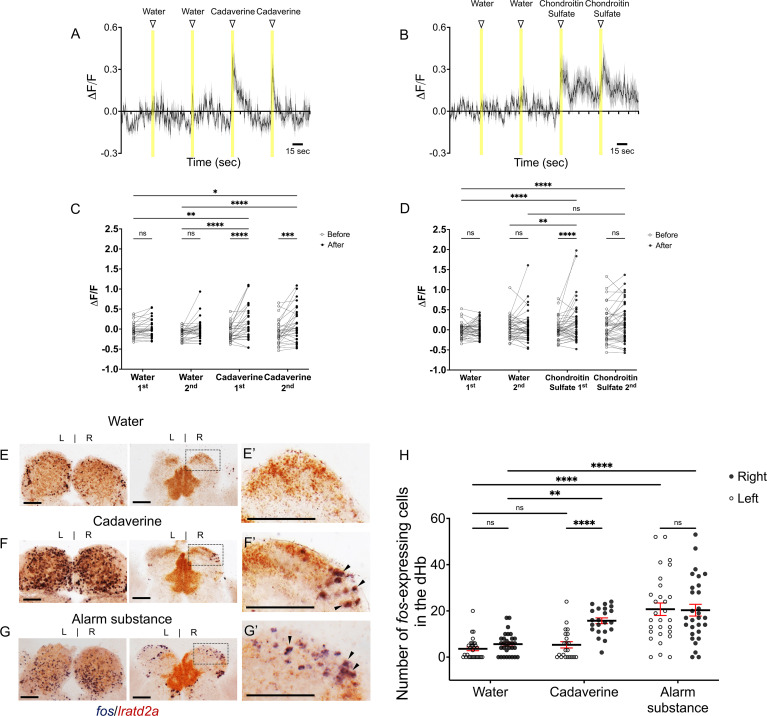
Figure 2 Increased activity of lratd2a-expressing dHb neurons upon exposure to aversive olfactory cues.
(A?B) Average change in fluorescence (?F/F) in seconds (sec) for all lratd2a positive neurons in the larval right dHb over a 5 min interval. Yellow bars indicate consecutive 5 s intervals of vehicle or odor delivery. Solid lines represent mean responses to (A) cadaverine or (B) to chondroitin sulfate and shadings represent the standard error of the mean (SEM). (C?D) Change in the intensity of GCaMP6f fluorescence for lratd2a neurons in the right dHb in response to consecutive delivery of (C) water or cadaverine [n = 30 neurons in three larvae, 0.009 ± 0.039 ?F/F for water, 0.148 ± 0.074 ?F/F for cadaverine] and of (D) water or chondroitin sulfate [n = 43 neurons in four larvae, 0.039 ± 0.037 ?F/F for water, 0.176 ± 0.069 ?F/F for chondroitin sulfate] at seven dpf, respectively. Two-way ANOVA reveals a significant effect of time [F(1, 29) = 32.09, p < 0.0001], interaction [F(3, 87) = 3.797, p = 0.0131] but no effect of vehicle vs. odorants [F(3, 87) = 1.169, p = 0.3262] for cadaverine; and a significant effect of time [F(1, 42) = 4.754, p = 0.0349], vehicle vs. odorants [F(3, 126) = 2.825, p = 0.0414] and interaction [F(3, 126) = 4.256, p = 0.0067] for chondroitin sulfate. Post-hoc analysis by Bonferroni?s multiple comparisons. (E?G) Colocalization of fos and lratd2a transcripts in transverse sections of adult olfactory bulbs (left panels) and habenulae (middle panels) detected by double labeling RNA in situ hybridization 30 min after addition of (E) water, (F) cadaverine, or (G) alarm substance to the test tank. (E?-G?) Higher magnification images (corresponding to dashed boxes in E-G) show lratd2a (brown) coexpressed with fos (blue) in cells of the right dHb (arrowheads). Scale bars, 100 ?m. (H) Quantification of fos-expressing cells in the adult dHb after addition of water [3.58 ± 0.811 cells in the left and 5.61 ± 0.85 in the right dHb, n = 31 sections from 16 adult brains], cadaverine [5.32 ± 1.36 cells in the left and 15.73 ± 1.25 in the right dHb, n = 22 sections from 11 adult brains], or alarm substance [20.72 ± 2.70 cells in the left and 20.31 ± 2.53 in the right dHb, n = 29 sections from 17 adult brains]. For the right dHb, significantly more cells were fos positive after addition of cadaverine (p = 0.0031) or alarm substance (p < 0.0001). For the left dHb, a significant difference was only observed after addition of alarm substance (p < 0.0001). Two-way mixed ANOVA reveals a significant effect of group [F(2, 60) = 30.18, p < 0.0001], left vs. right [F(1, 30) = 13.02, p = 0.0011] and interaction [F(2, 38) = 7.881, p = 0.0014]. Post-hoc analysis by Bonferroni?s multiple comparisons. All numbers represent the mean ± SEM.

