
|
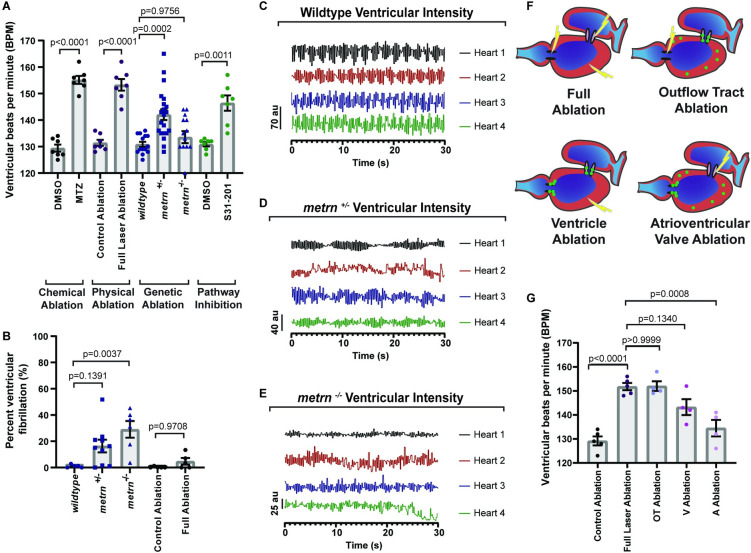
Fig 8
(A) Quantification of the number of ventricular contractions (bpm) at 6 dpf after various gfap+ ablation techniques. (B) Quantification of percent duration of ventricular fibrillation in metrn?/? animals and Tg(gfap:nucGFP) animals with full laser ablation of nucGFP+ cells. (C) Representative graphs of ventricular blood flow intensity (au) over time in wild-type animals. (D) Representative graphs of ventricular blood flow intensity (au) over time in metrn+/? animals. (E) Representative graphs of ventricular blood flow intensity (au) over time in metrn?/? animals. (F) Schematic of gfap+ ablation by location. Green dots denote gfap+ cells. Lightning denotes ablation. (G) Quantification of number of ventricular contractions at 6 dpf after ablation of gfap+ by location. Data are represented as mean � SEM. Statistics summarized in S1 Table. See S1 Data for raw data. A, atrium; bpm, beats per minute; CNG, cardiac nexus glia; dpf, days postfertilization; MTZ, metronidazole; OT, outflow tract; V, ventricle.