
|
FIGURE 3
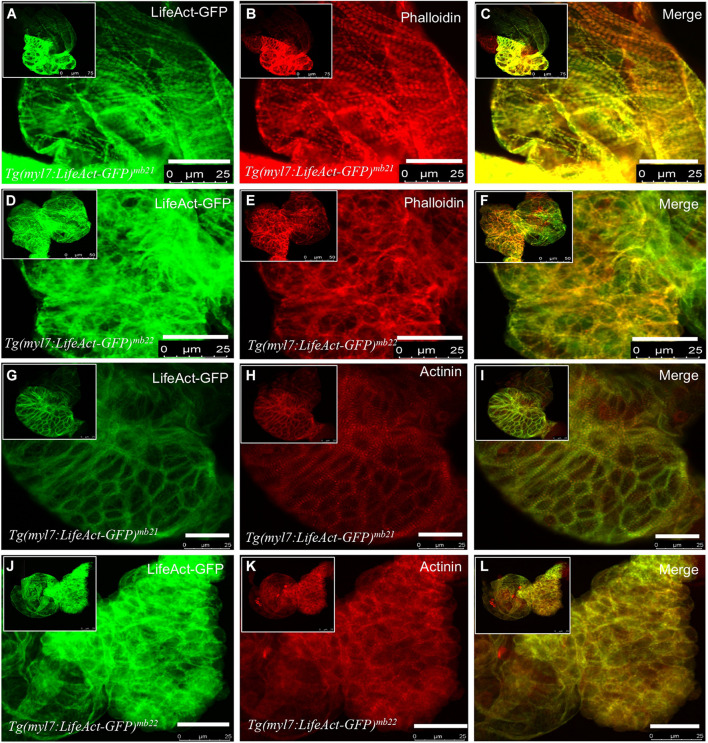
The effect of Lifeact-GFP expression on actin filament and sarcomere organization in cardiomyocytes of Tg(myl7:Lifeact-GFP)mb21 and Tg(myl7:Lifeact-GFP)mb22 transgenic embryos. (A?F) Actin think filaments revealed by Lifeact-GFP (A,D) and phalloidin staining (B,E) in Tg(myl7:Lifeact-GFP)mb21 (A?C), and Tg(myl7:Lifeact-GFP)mb22 (D?F) transgenic embryos at 72 hpf. (C,F) are merged pictures of A-B and D-E, respectively. (G?L) The sarcomeric organization of actin think filament and Z-lines revealed by Lifeact-GFP (G,J) anti-?-actinin antibody staining (H,K) in Tg(myl7:Lifeact-GFP)mb21 (G?I), and Tg(myl7:Lifeact-GFP)mb22 (J?L) transgenic embryos at 72 hpf. (I,L) are merged pictures of (G,H,J,K), respectively. Scale bars: 25 ?m.