
|
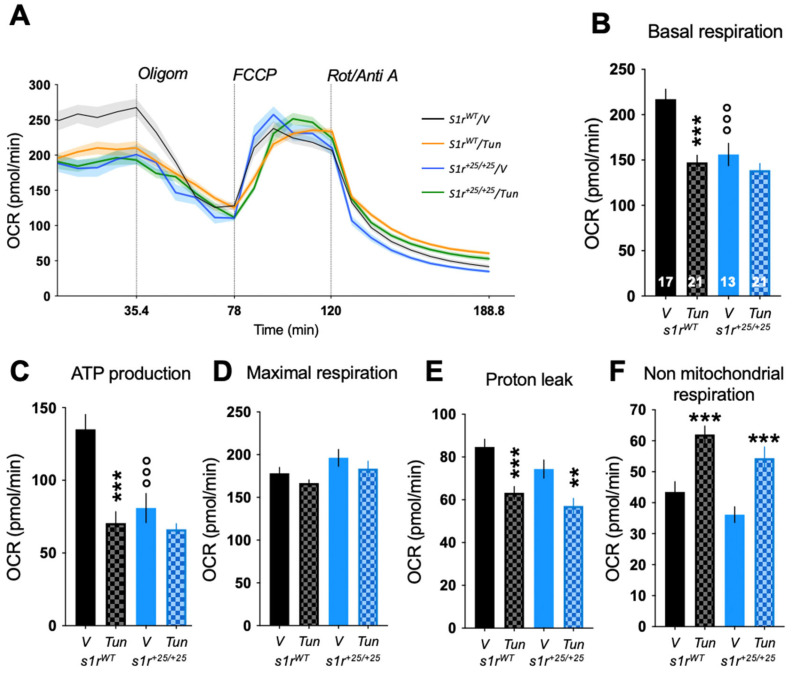
Figure 7 Effect of the Tunicamycin (Tun, 2 �g/mL, 24 h) challenge on mitochondrial respiration of the zebrafish larvae at 5 dpf analyzed using the Seahorse XF mito stress test. (A) Profiles of oxygen consumption rate (OCR) during the assay. (B) Basal respiration, (C) ATP production, (D) maximal respiration, (E) proton leak, (F) non-mitochondrial respiration. Data are shown as mean � SEM from the number of larvae indicated in (B). Abbreviations: Oligom, oligomycin (25 ?M); FCCP, carbonyl cyanide-p-trifluoromethoxyphenylhydrazone (8 ?M); Rot/Anti A, rotenone + antimycin A (15 ?M). ** p < 0.01, *** p < 0.001 vs. V-treated; ��� p < 0.001 vs. s1rWT; Newman-Keuls? test after a two-way ANOVA.