
|
Figure 5
NSC division events are spatiotemporally coordinated
(A) MC positions at time point t are compared, using point pattern statistics, with MC positions at other time points after fixed intervals (t+Δt), for each possible Δt (3, 6, 9, and 15 days).
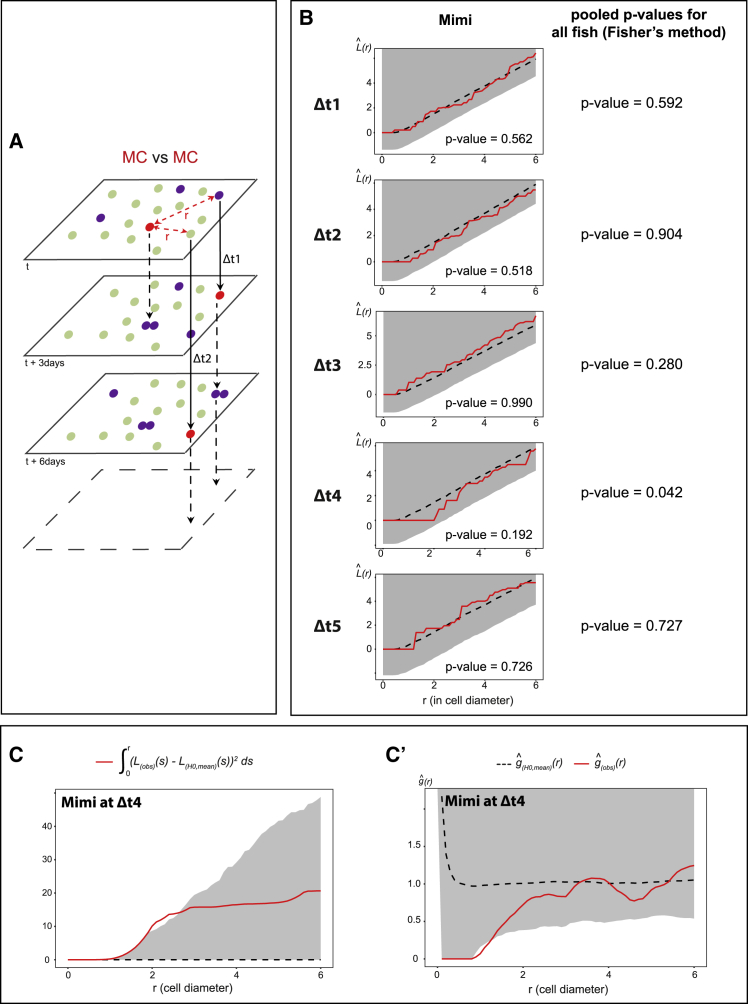
(B) Left: Besag’s
(C and C’) Illustrations for Mimi. (C) Integrated square of the negative deviation between