Figure 6
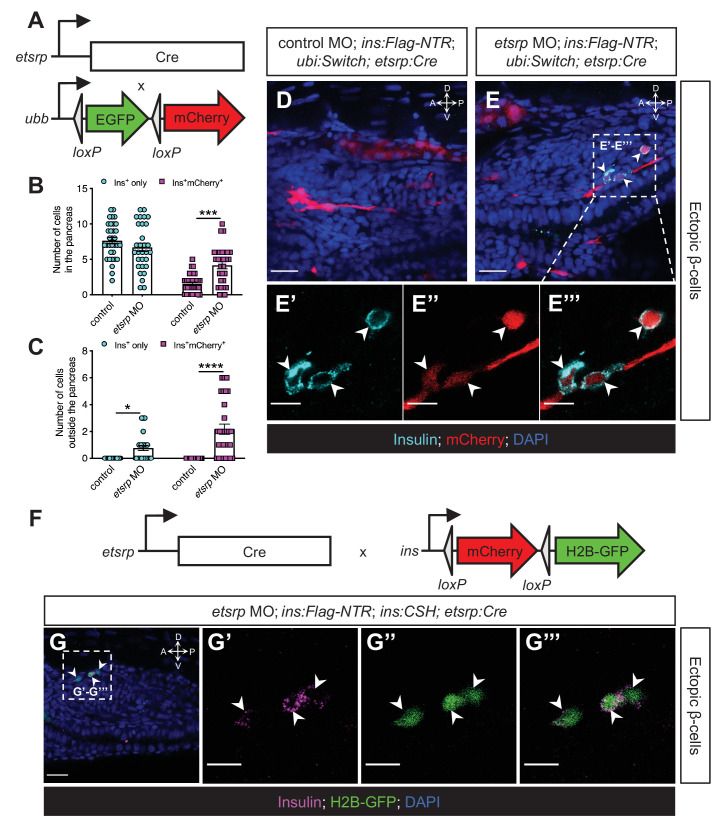
(A) Constructs of etsrp:Cre and ?3.5ubb:LOXP-EGFP-LOXP-mCherry (ubi:Switch). (B, C) Quantification of the pancreatic or ectopic ?-cells with or without etsrp-positive mesodermal origin in control or etsrp morpholino (MO)-injected larvae at 3 dpf. *p=0.0169, ***p=0.0002, and ****p<0.0001 (?idák?s multiple comparisons test); n=33 (control) and 30 (etsrp MO). Data are represented as the mean ± SEM. (D?E???) Representative confocal images of ectopic ?-cells and etsrp-positive lineage-traced cells in control or etsrp MO-injected Tg(ins:Flag-NTR);Tg(ubi:Switch);Tg(etsrp:Cre) zebrafish larvae at 3 dpf after ?-cell ablation by MTZ at 1?2 dpf, displaying ?-cells in cyan with immunostaining for insulin and lineage-traced cells derived from etsrp-expressing mesodermal cells in red from the Cre-recombined ubi:Switch. The selected area in a dashed square in (E) is magnified in split (E?, E??) and merged (E???) channels, respectively. Arrowheads point to ectopic ?-cells derived from the mesoderm (E?E???). (F) Constructs of etsrp:Cre and ins:LOXP-mCherry-LOXP-Hsa.HIST1H2BJ-GFP (ins:CSH). (G?G???) Representative confocal images of ectopic ?-cells derived from the etsrp-expressing lineage in etsrp MO-injected Tg(ins:Flag-NTR);Tg(ins:CSH);Tg(etsrp:Cre) zebrafish larvae at 3 dpf after ?-cell ablation by MTZ at 1?2 dpf, displaying ?-cells in magenta with immunostaining for insulin and lineage-traced cells derived from etsrp-expressing mesodermal cells in nuclear green from the Cre-recombined ins:CSH. The selected area in a dashed square in (G) is magnified in split (G? and G??) and merged (G???) channels, respectively. Scale bars = 20 ?m (D, E, and G) or 10 ?m (E??E??? and G??G???). Anatomical axes: D (dorsal), V (ventral), A (anterior), and P (posterior).
The ectopic ?-cells derive from the etsrp-expressing mesodermal lineage in etsrp morphants.
Image
Figure Caption
Acknowledgments
This image is the copyrighted work of the attributed author or publisher, and
ZFIN has permission only to display this image to its users.
Additional permissions should be obtained from the applicable author or publisher of the image.
Full text @ Elife

