IMAGE

Fig. 1

ID
ZDB-IMAGE-210725-21
Genes
Source
Figures for Wang et al., 2021
Image
Figure Caption

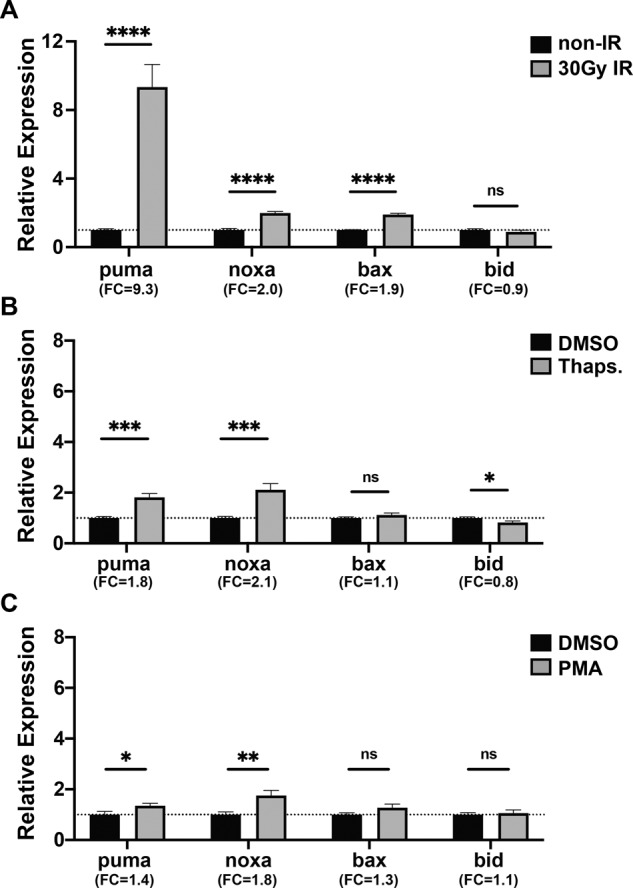
Fig. 1 Quantitative real-time PCR (qRT-PCR) analysis of pro-apoptotic markers after IR- and drug-induction in wild-type zebrafish embryos.

24 hpf zebrafish embryos were treated with A 30 Gy IR-irradiation, B 5 μM Thapsigargin (Thaps.), and C 3.3 μM Phorbol 12-myristate 13-acetate (PMA); and qRT-PCR was performed at 6 h (A) or 4 h (B, C) after treatment. Expression levels were normalized to GAPDH. n = 9 (A, B) and n = 7 (C) from ~30 pooled embryos per sample. Bars represent mean ± SEM. *p < 0.05; **p < 0.01; ***p < 0.001; ****p < 0.0001. Fold change (FC) is indicated.

Figure Data
Acknowledgments
This image is the copyrighted work of the attributed author or publisher, and ZFIN has permission only to display this image to its users. Additional permissions should be obtained from the applicable author or publisher of the image. Full text @ Cell Death Dis.