IMAGE

FIGURE 7

ID
ZDB-IMAGE-210718-30
Antibodies
Source
Figures for Łysyganicz et al., 2021
Image
Figure Caption

FIGURE 7

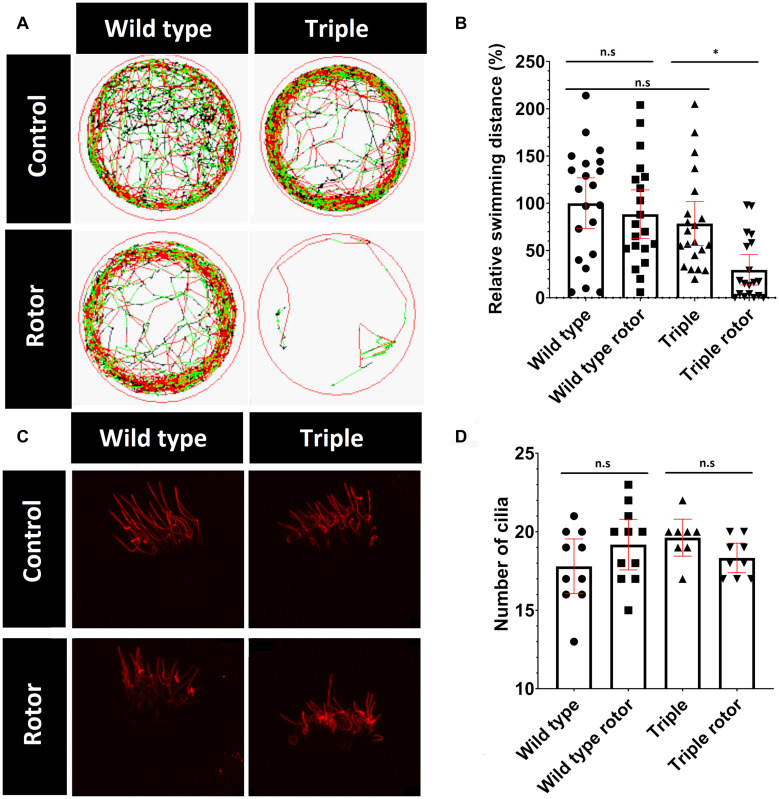
Change in mutant behavior. (A) Tracks of swimming patterns of Wild type and Triple mutant fish treated and untreated with disorientating stimulus. Black lines correspond to slow swimming (<5 mm/s), green lines indicate medium speed (5–10 mm/s) and red lines indicate fast swimming (>10 mm/s). The figure shows a representative swimming pattern of one larvae. (B) Swimming distance normalized to swimming distance by non-treated wild types. (C) TAP952 stained cilia in cristae of treated and untreated fish. (D) Number of cilia in cristae (mean with 95% CI. T-test *p < 0.05). ns, no significant.

Figure Data
Acknowledgments
This image is the copyrighted work of the attributed author or publisher, and ZFIN has permission only to display this image to its users. Additional permissions should be obtained from the applicable author or publisher of the image. Full text @ Front Cell Dev Biol