IMAGE

Fig. 4

ID
ZDB-IMAGE-210611-36
Source
Figures for Griffin et al., 2021
Image
Figure Caption

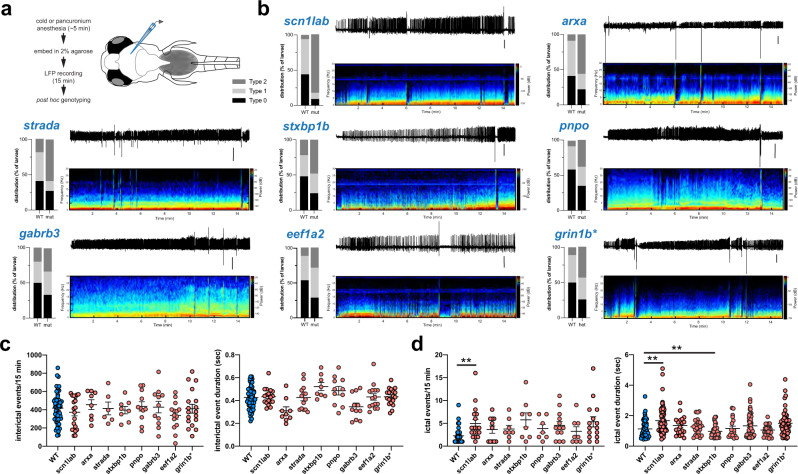
Fig. 4 Electrographic seizure activity in epileptic zebrafish mutant lines.

a Schematic of recording configuration and protocol for electrophysiology-based screening of larval zebrafish. b Representative raw LFP-recording traces along with a corresponding wavelet time-frequency spectrogram and LFP scoring distribution plot for WT and mutant larvae are shown for each EZP epilepsy line. Type 0, I, and II scoring as in Fig. 2. A representative WT LFP recording with the corresponding wavelet time-frequency spectrogram is shown in Supplementary Figure 5. Scale bar = 500 µV. Representative LFP recordings and distribution plots for all 37 lines can be found online (https://zebrafishproject.ucsf.edu). c Cumulative plots of interictal event frequency and duration for all EZP epilepsy lines compared with WT sibling controls. Each point represents mean of all interictal events in a single 15 min larval LFP recording detected using custom software in MATLAB (N = 9775, WT; N = 6750, scn1lab; N = 2550, arxa; N = 5790, strada; N = 6750, stxbp1b; N = 3538, pnpo; N = 3455, gabrb3; N = 4335, eef1a2; N = 6610, grin1b*). d Cumulative plots of ictal event frequency and duration. Each point represents all ictal events in a single 15 min larval LFP recording (N = 56, WT; N = 62, scn1lab; N = 26, arxa; N = 26, strada; N = 48, stxbp1b; N = 22, pnpo; N = 59, gabrb3; N = 27, eef1a2; N = 55, grin1b*). *for grin1b designates heterozygote. **p < 0.01, ANOVA with Dunnett’s multiple comparisons test. Data displayed as mean ± SEM.

Acknowledgments
This image is the copyrighted work of the attributed author or publisher, and ZFIN has permission only to display this image to its users. Additional permissions should be obtained from the applicable author or publisher of the image. Full text @ Commun Biol