
|
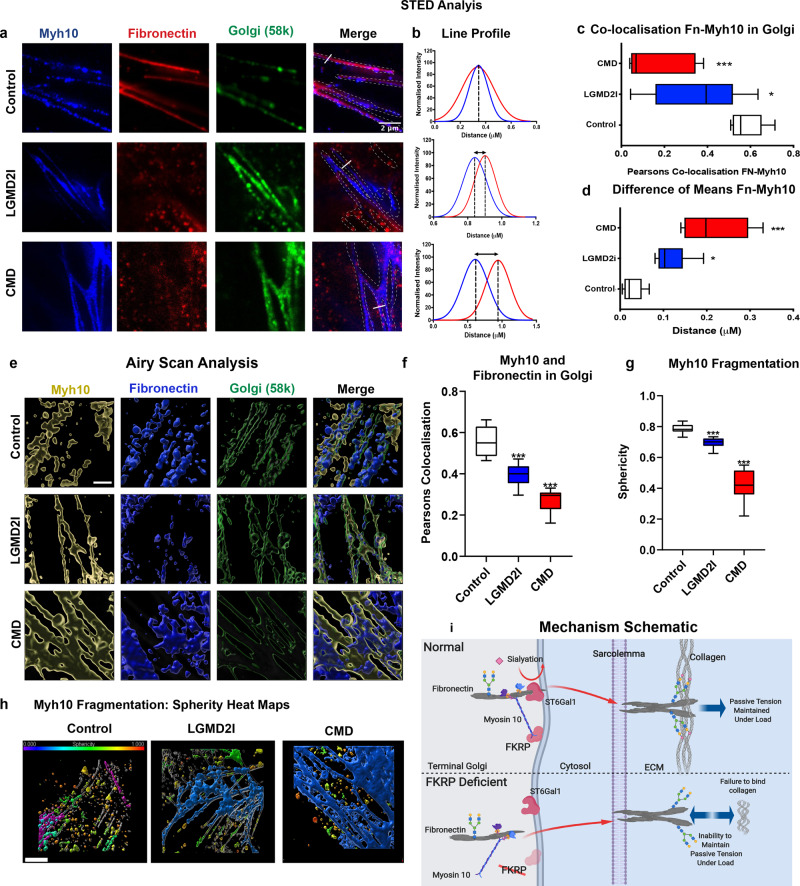
Fig. 4
Fibronectin and myosin10 protein localisation within the trans-Golgi, as determined by STED microscopy and Gaussian distribution line profile analyses, images representative of a minimum of three repeats separated by a minimum of a week and three technical repeats.