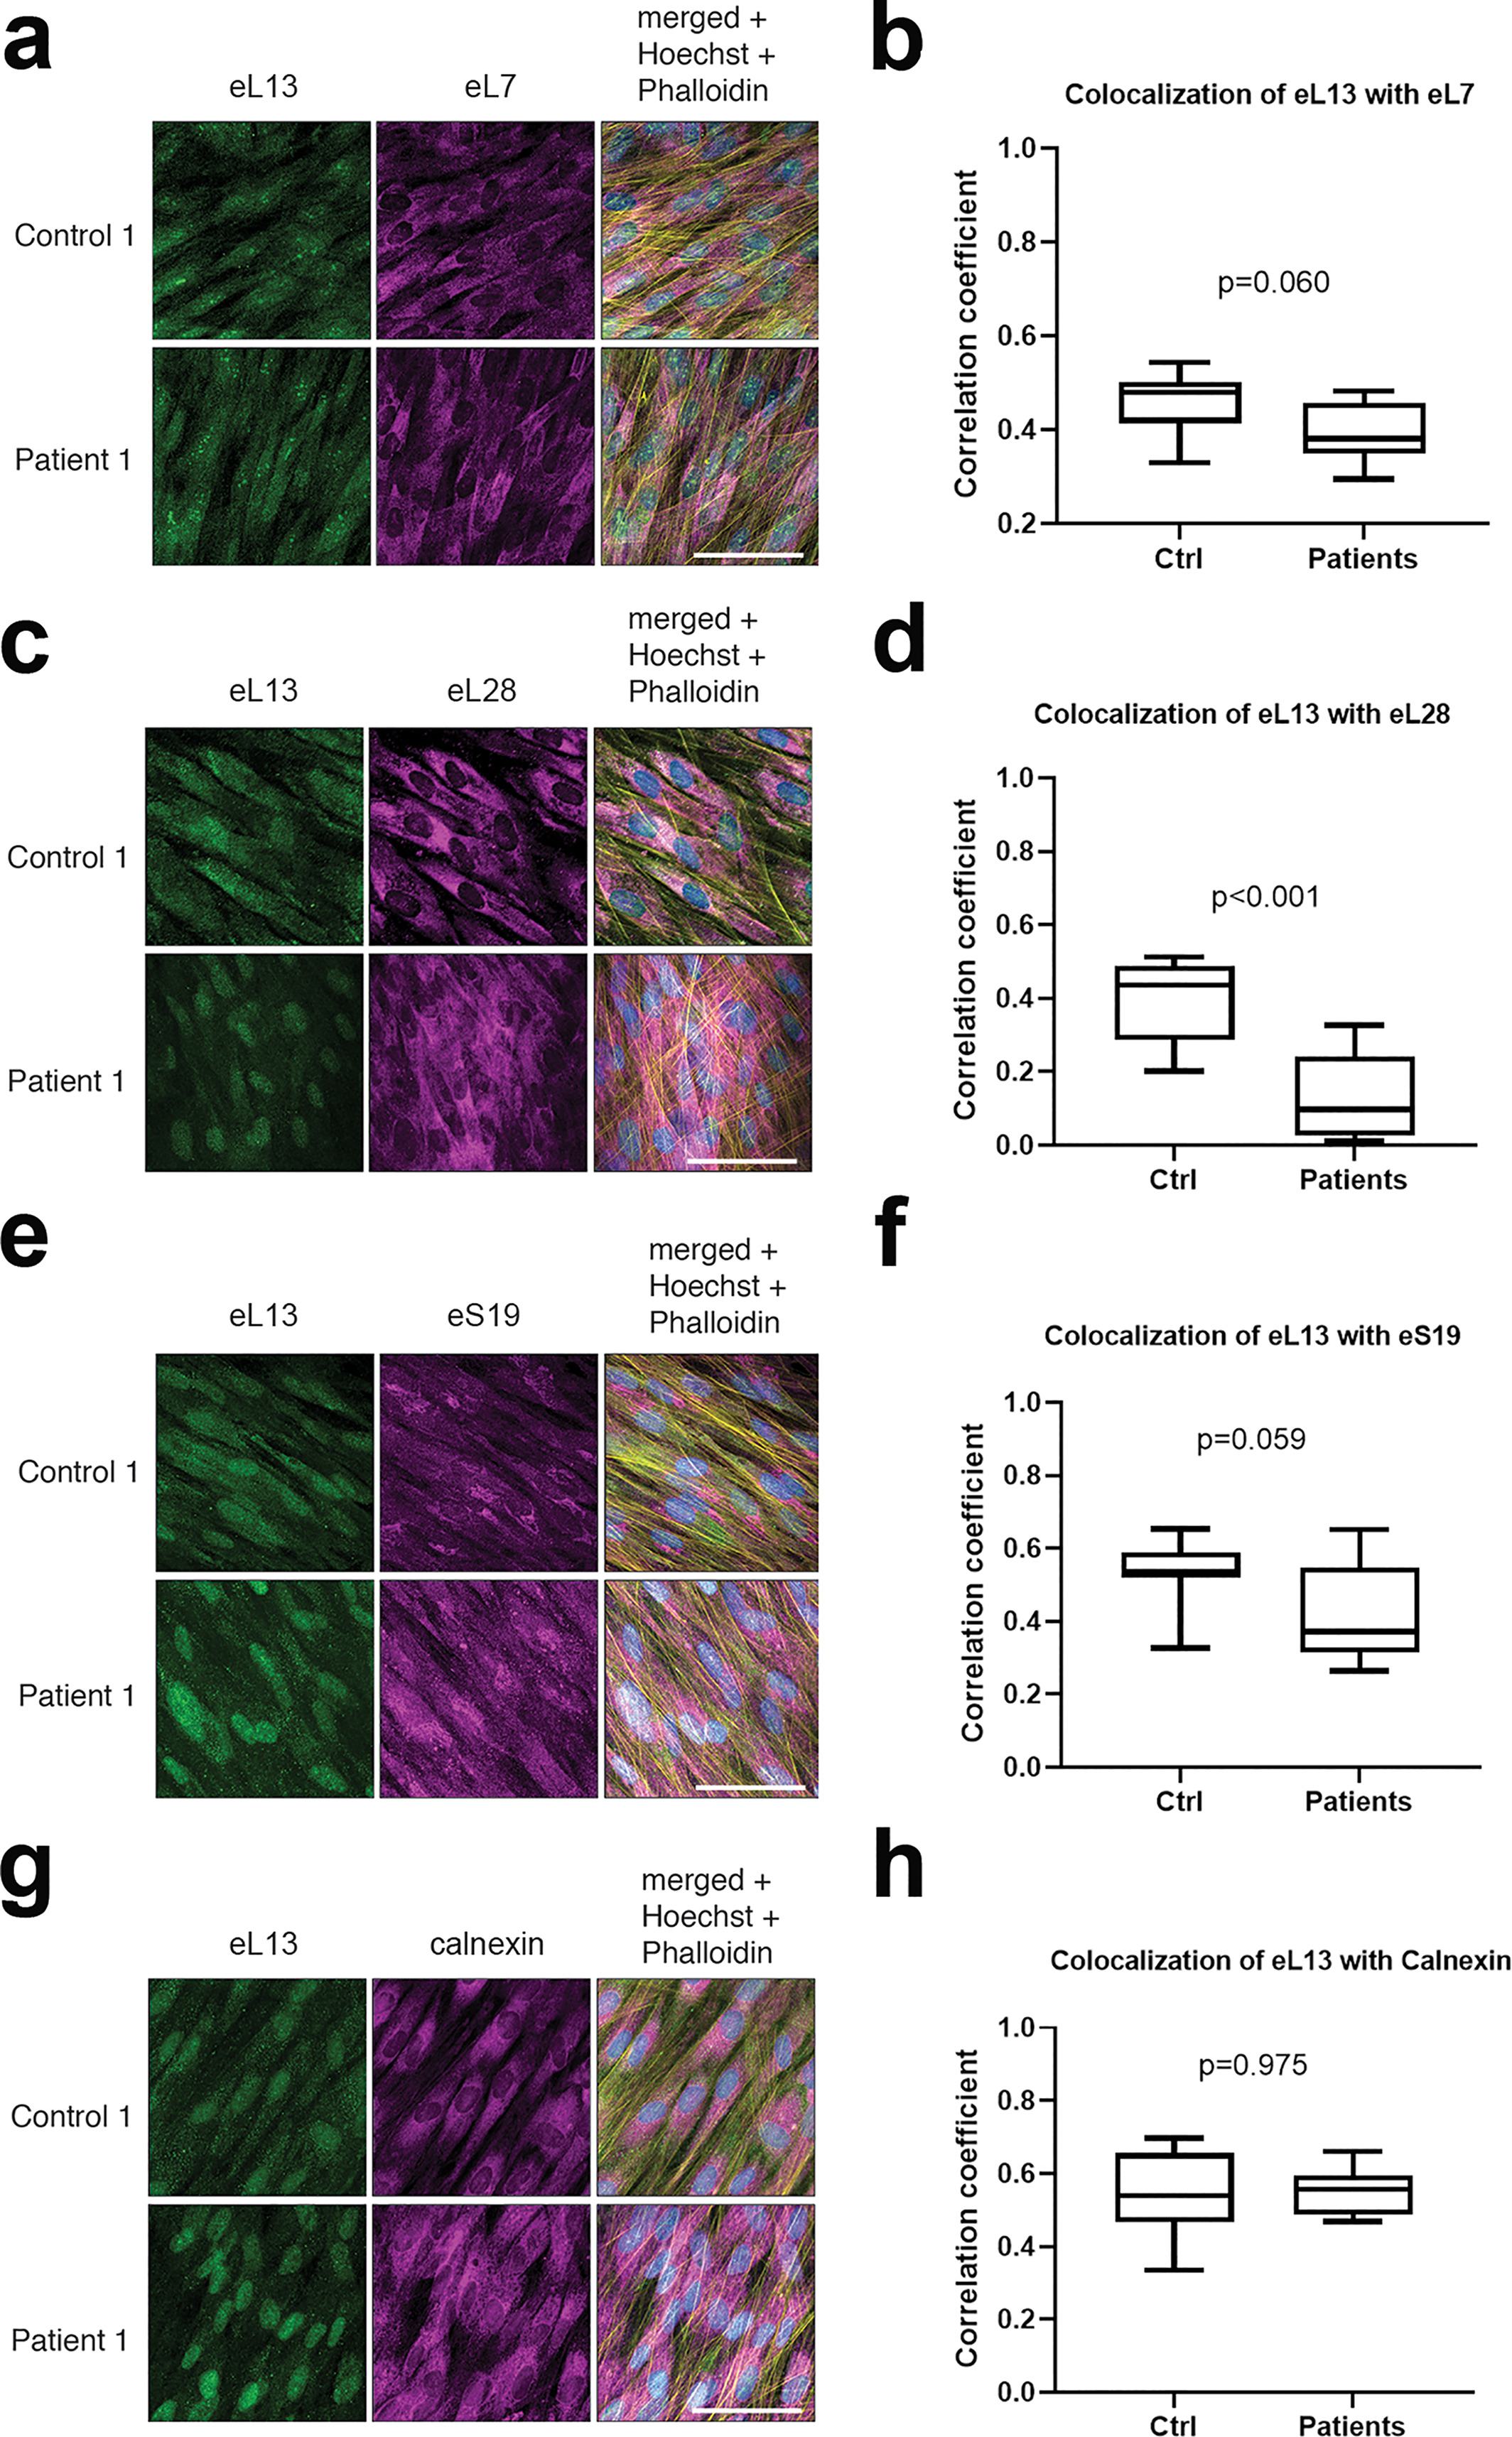
Fig. 4 Comparison of colocalization of eL13 with other ribosomal proteins and with ER. Representative immunofluorescence images of dermal fibroblasts from patient 1 and one healthy control showing co?staining of eL13 with eL7 (A), eL28 (C), eS19 (E), and with calnexin as a marker of ER (G). Scale bars = 30??m. 3D colocalization of mutant and WT eL13 with the selected ribosomal markers was analyzed from entire z?stacks of three samples from patients 1 to 3 (n =?3) and each healthy control (n =?3) using the colocalization test plugin of ImageJ Fiji and is expressed as correlation coefficient (B, D, F, H). Box plots with median and range; p values from Mann?Whitney U test.
Image
Figure Caption
Acknowledgments
This image is the copyrighted work of the attributed author or publisher, and
ZFIN has permission only to display this image to its users.
Additional permissions should be obtained from the applicable author or publisher of the image.
Full text @ J. Bone Miner. Res.

