IMAGE

FIG 2

ID
ZDB-IMAGE-210219-5
Source
Figures for Bastos et al., 2020
Image
Figure Caption

FIG 2

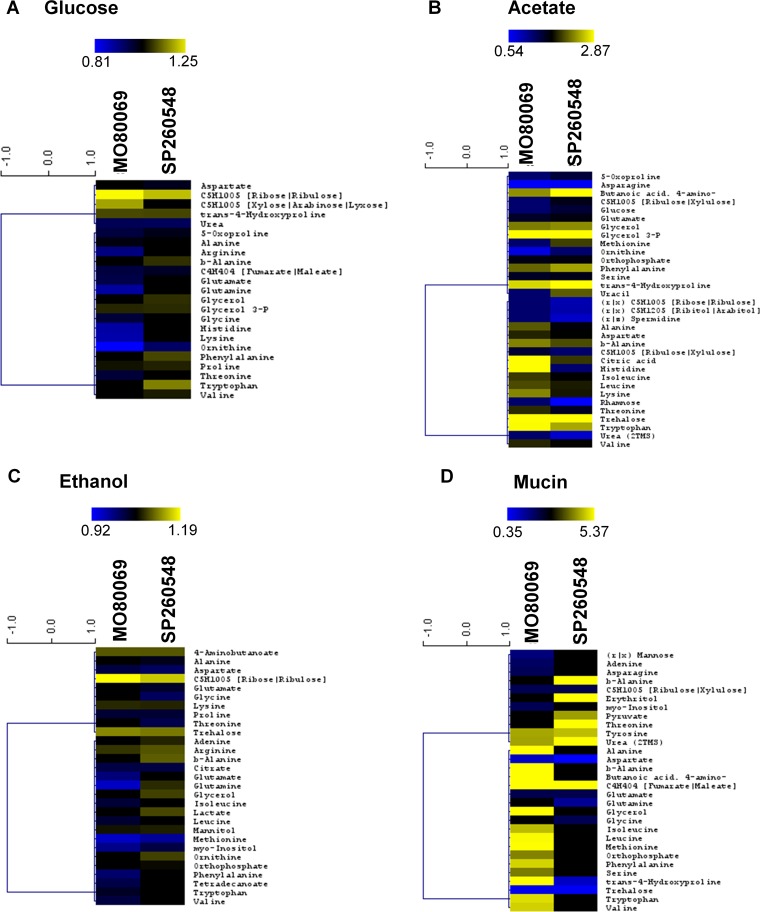
The A. nidulans clinical isolates are metabolically different from the reference strain in the presence of different carbon sources. (A to D) Heat maps depicting log fold changes of identified metabolite quantities that were significantly (P < 0.05) different in the A. nidulans clinical isolates MO80069 and SP-2605-48 compared to levels in the FGSC A4 reference strain (gray squares depict metabolite quantities that were not detected as significantly different in one of the clinical isolates).

Acknowledgments
This image is the copyrighted work of the attributed author or publisher, and ZFIN has permission only to display this image to its users. Additional permissions should be obtained from the applicable author or publisher of the image. Full text @ mSphere