
|
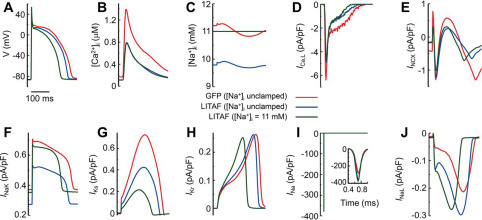
Fig. 7 Figure 7. Computer simulations of rabbit ventricular myocytes. Cardiomyocytes were paced at 2.5 Hz under three different conditions: transduced with adenovirus encoding GFP with intracellular sodium concentration [Na+]i unclamped (red traces); adenovirally transduced causing LITAF overexpression with [Na+]i unclamped (blue traces); and adenoviral overexpression of LITAF with [Na+]i clamped to the same average steady-state 11 mm value reached under GFP (green traces). Transmembrane voltage V (A), cytosolic calcium concentration [Ca2+]iB), [Na+]i C), L-type calcium current ICa,L (D), Na+/Ca2+ exchanger current INCX (E), Na+/K+-pump current INaK (F), slowly activating delayed rectifier K+ current IKs (G), rapidly activating delayed rectifier K+ current IKr (H), fast sodium current INa (I), and late sodium current INaL (J).