IMAGE

Figure 2

ID
ZDB-IMAGE-210217-20
Source
Figures for Gao et al., 2021
Image
Figure Caption

Figure 2

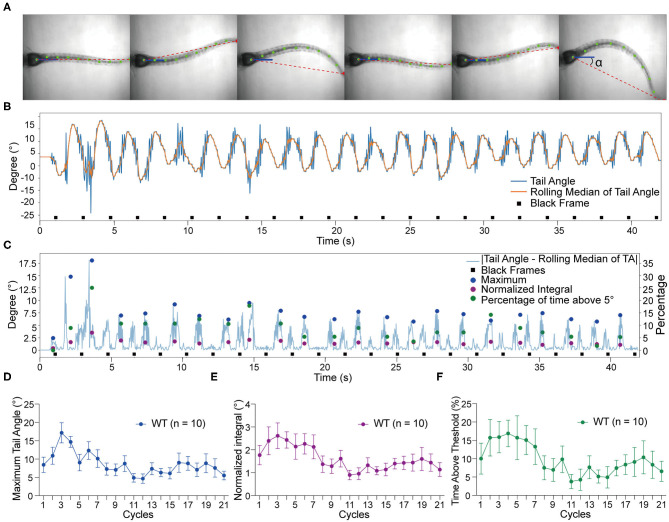
Tracking of tail movements using ZebraZoom software. (A) Six contiguous frames of tail movements from a wild type larva. ZebraZoom calculates the angle of the red dotted line and the horizontal line as real tail angle (α). (B) Representative tracking trace of tail movements from a wild type larva. (C) The output data of the maximum tail angle, normalized integral, and percentage of time above threshold are displayed as colored dots. (D–F) Group data of wild type larvae (n = 10) for maximum tail angle, normalized integral, and percentage of time above threshold. Means ± SEM are shown.

Acknowledgments
This image is the copyrighted work of the attributed author or publisher, and ZFIN has permission only to display this image to its users. Additional permissions should be obtained from the applicable author or publisher of the image. Full text @ Front. Mol. Neurosci.