IMAGE

Figure 3

ID
ZDB-IMAGE-210130-20
Antibodies
Source
Figures for Brunal et al., 2021
Image
Figure Caption

Figure 3

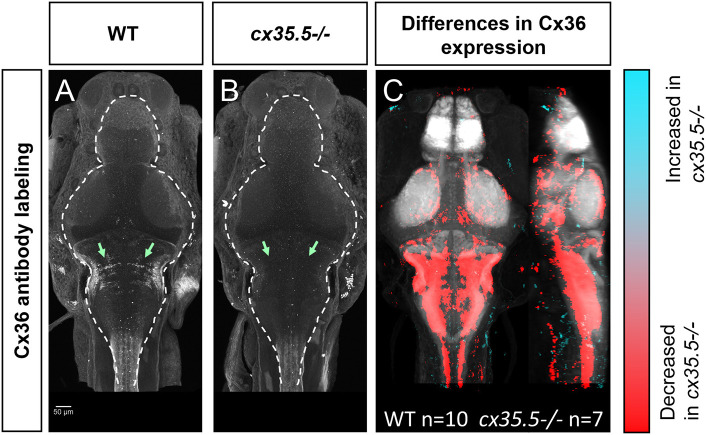
Whole-brain expression map of cx35.5-/- vs. wild-type zebrafish larvae immunostaining of anti-Cx36. (A,B) Anti-Cx36 staining in wild-type fish (A) and cx35.5-/- fish (B). (C) Whole-brain expression map showing increased expression in cx35.5-/- (cyan) and increased expression in wild type (red) showing the comparison of Cx36 expression between cx35.5-/- and wild type. Regions with increased Cx36 expression in cx35.5-/- are shown in cyan and regions with decreased Cx36 expression in cx35.5-/- are shown in red. Wild type n = 10, cx35.5-/- n = 7.

Figure Data
Acknowledgments
This image is the copyrighted work of the attributed author or publisher, and ZFIN has permission only to display this image to its users. Additional permissions should be obtained from the applicable author or publisher of the image. Full text @ Front. Mol. Neurosci.