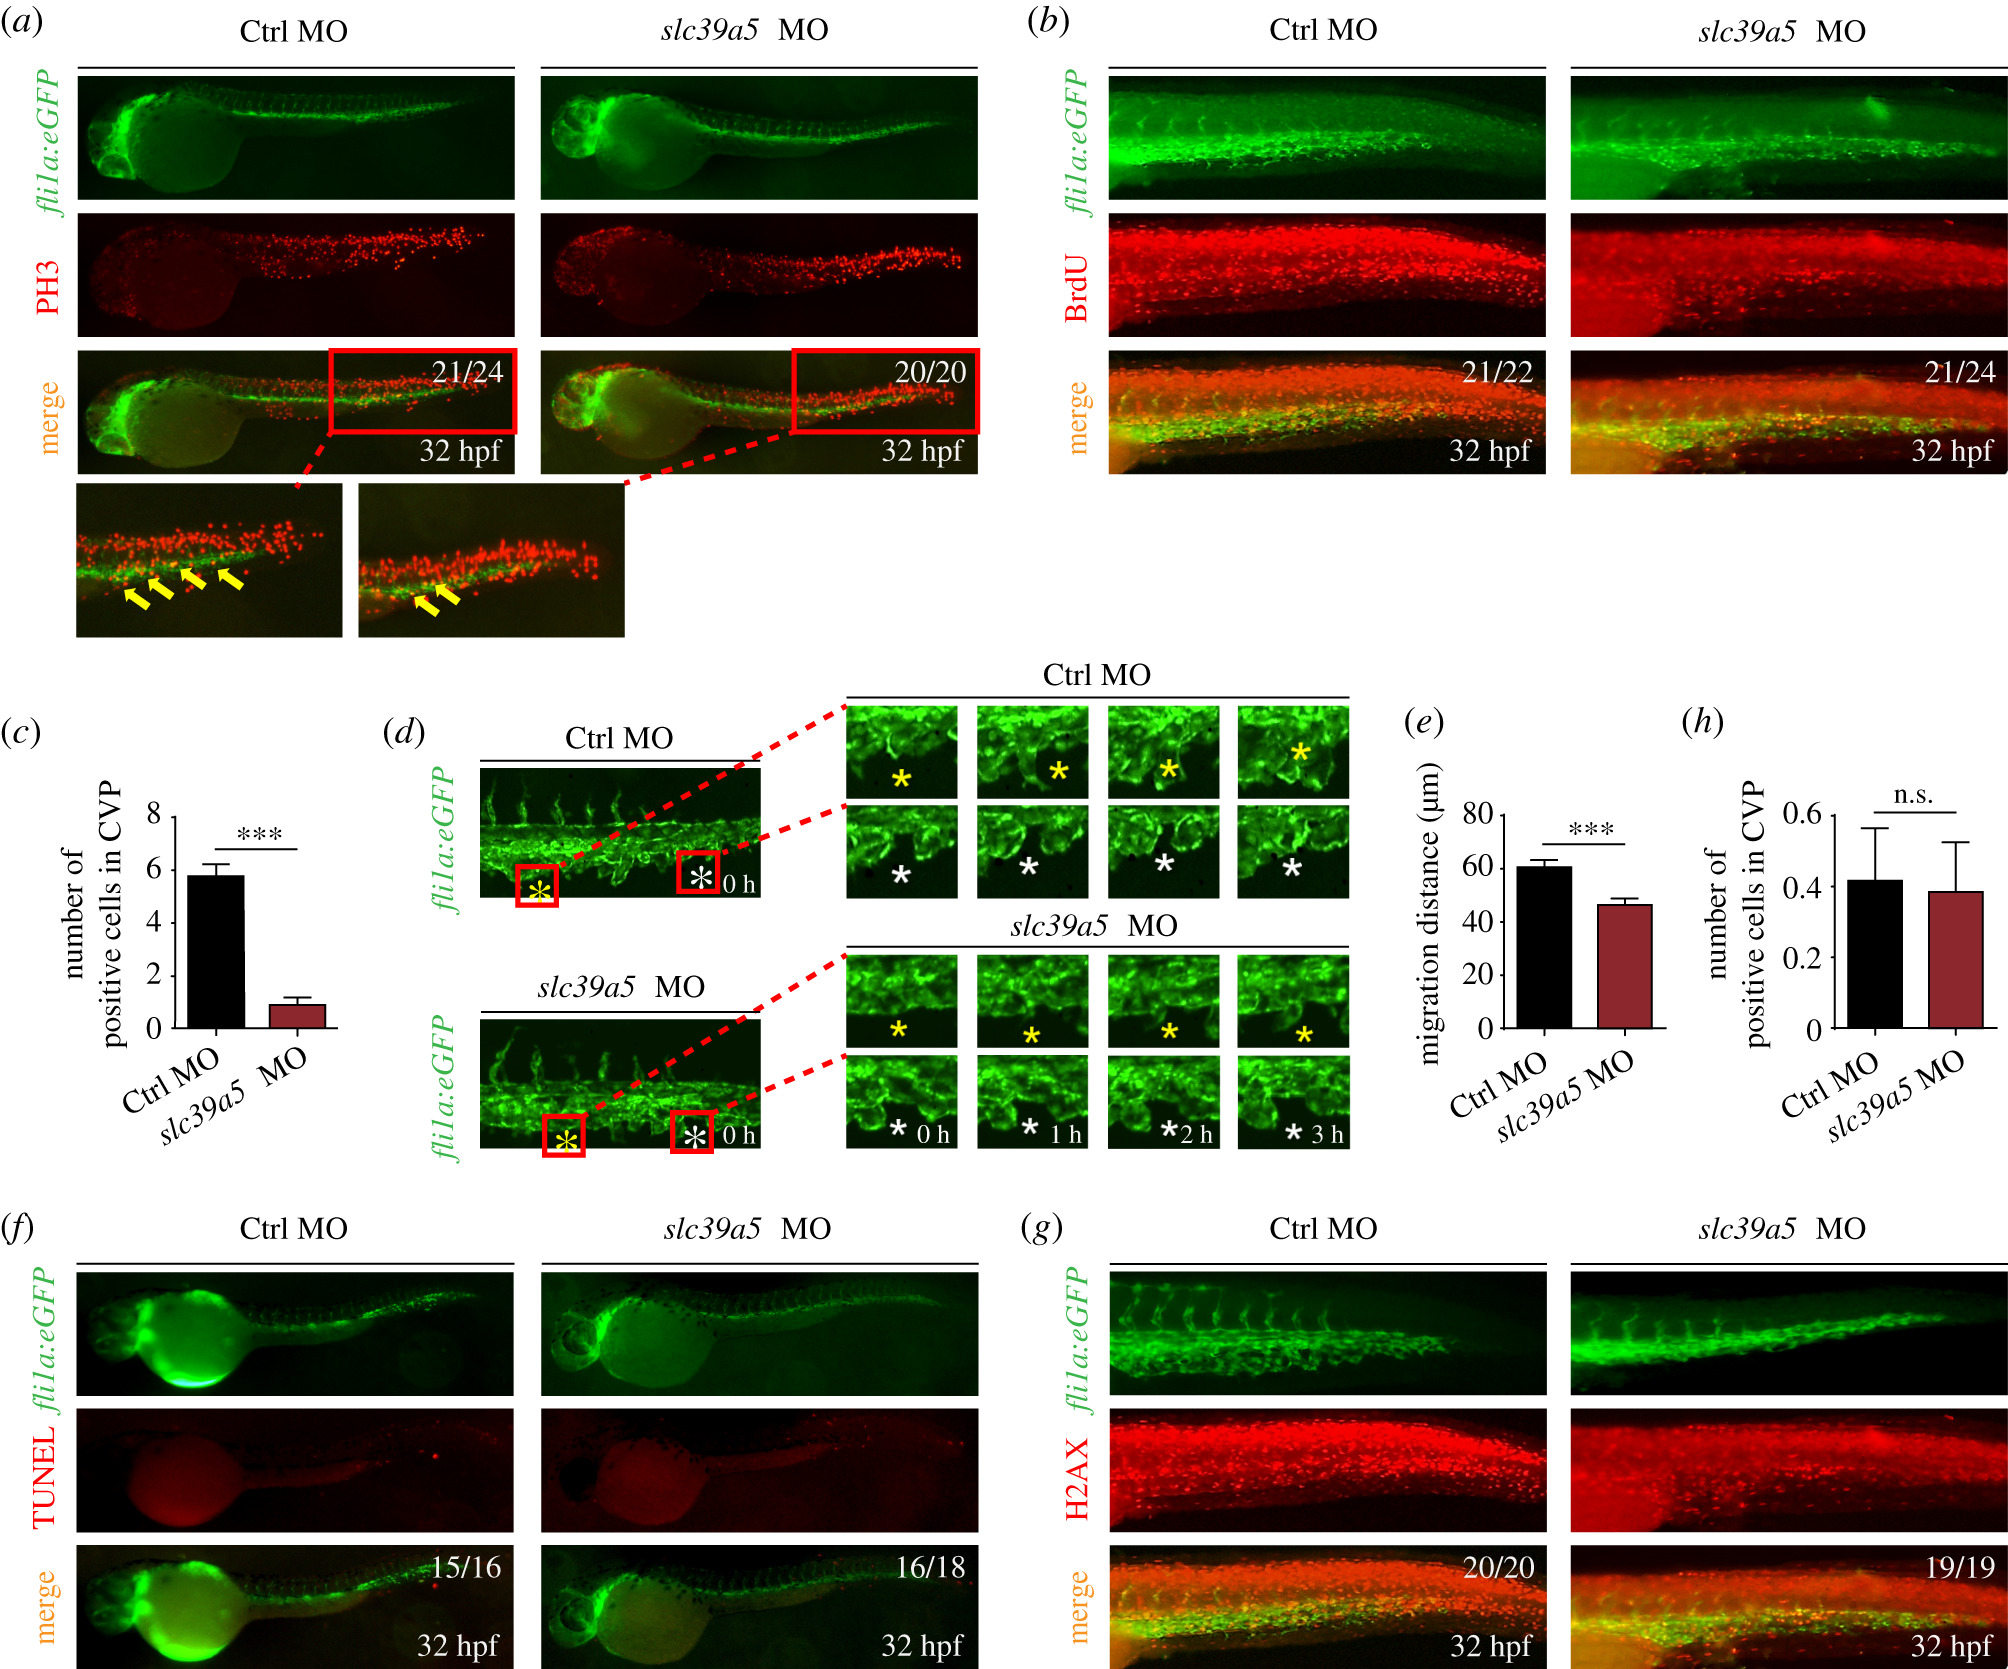
Fig. 3 slc39a5 morphants have impaired endothelial cell proliferation and migration in the CVP region. (a?b) PH3 (a) and BrdU (b) immunostaining of control and slc39a5 morphant Tg(fli1a:eGFP) embryos, with magnified views of the CVP showing co-localization of GFP fluorescence and PH3 immunoreactivity (arrows). (c) Summary of BrdU-positive cells in the CVP of control and slc39a5 morphants. ***p < 0.001. (d) Representative sequential images of the CVP in control and slc39a5 morphant Tg(fli1a:eGFP) embryos. For each embryo, two separate endothelial cells are indicated with a white asterisk and a yellow asterisk. Note that 0 h corresponds to 32 hpf. (e) Summary of the migration distance of endothelial cells from 32 to 35 hpf in the CVP of control and slc39a5 morphant Tg(fli1a:eGFP) embryos. (f) Representative images of TUNEL staining in the CVP of control and slc39a5 morphant Tg(fli1a:eGFP) embryos. (g?h) Representative images (g) and summary (h) of H2AX immunostaining in the CVP of control and slc39a5 morphant Tg(fli1a:eGFP) embryos.
Image
Figure Caption
Figure Data
Acknowledgments
This image is the copyrighted work of the attributed author or publisher, and
ZFIN has permission only to display this image to its users.
Additional permissions should be obtained from the applicable author or publisher of the image.
Full text @ Open Biol.

