IMAGE

Figure 7

ID
ZDB-IMAGE-200905-32
Source
Figures for Ghaddar et al., 2020
Image
Figure Caption

Figure 7

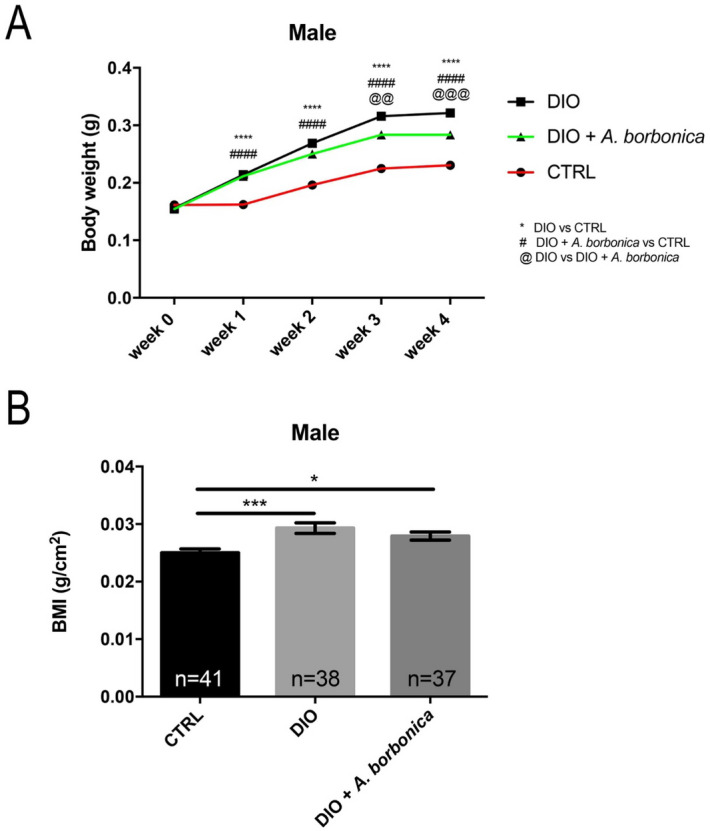
A. borbonica aqueous extracts slightly prevents from body weight gain and excessive BMI increase induced by DIO. (A) Line graph showing the increase in body weight of CTRL, DIO and DIO + A. borbonica during 4 weeks. (B) Graph showing the BMI of all groups at week 4. n = number of fish. One-way ANOVA (A) and Student's t-test (B): *p < 0.05 ***p < 0.001. Bar graph: standard error of the mean (SEM).

Acknowledgments
This image is the copyrighted work of the attributed author or publisher, and ZFIN has permission only to display this image to its users. Additional permissions should be obtained from the applicable author or publisher of the image. Full text @ Sci. Rep.