IMAGE

Figure 6

ID
ZDB-IMAGE-200905-31
Source
Figures for Ghaddar et al., 2020
Image
Figure Caption

Figure 6

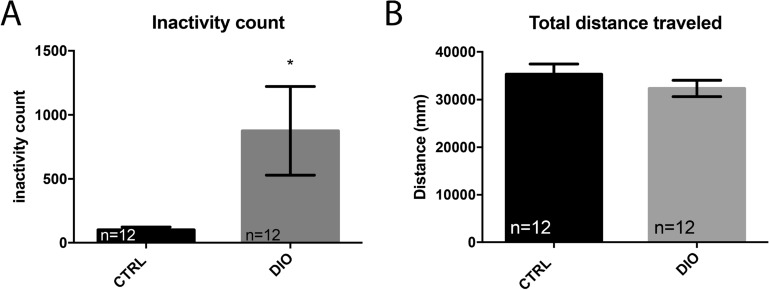
DIO increases the occurrence of inactivity in zebrafish. (A) graph showing the increased number of inactivity state (locomotion < 4 mm/sec) in DIO fish compared to controls, normalized to 100%. (B) graph showing that the total distance traveled during 10 min is similar between CTRL and DIO fish. n = 12 from 3 independent experiments. Student's t-test: *p < 0.05. Error bar: standard error of the mean (SEM).

Acknowledgments
This image is the copyrighted work of the attributed author or publisher, and ZFIN has permission only to display this image to its users. Additional permissions should be obtained from the applicable author or publisher of the image. Full text @ Sci. Rep.