IMAGE

Figure 1

ID
ZDB-IMAGE-200905-26
Source
Figures for Ghaddar et al., 2020
Image
Figure Caption

Figure 1

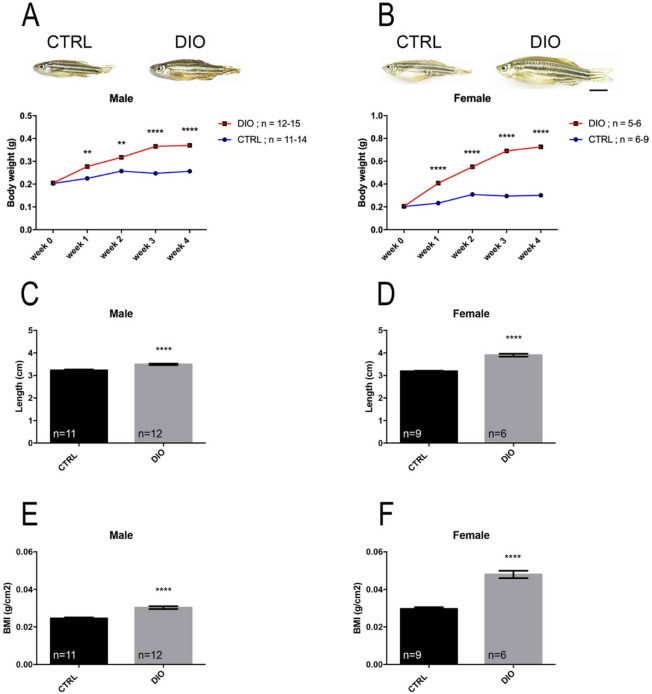
DIO results in increased body weight, length and BMI in both male and female zebrafish. (A), (B) Graphs illustrating the body weight measurements during 4 weeks for both CTRL and DIO-treated zebrafish in male and female, respectively. The zebrafish pictures highlight the morphological differences at week 4. (C), (D) Body length measurements at week 4 in male and female zebrafish, respectively. (E), (F) Body mass index (BMI; grams per square centimeter) calculated at week 4. n = number of fish. One-way ANOVA (A, B) and Student's t-test (CF): **p < 0.01; ****p < 0.0001. Error bars correspond to standard error of the mean (SEM). Scale bar: 7 mm.

Acknowledgments
This image is the copyrighted work of the attributed author or publisher, and ZFIN has permission only to display this image to its users. Additional permissions should be obtained from the applicable author or publisher of the image. Full text @ Sci. Rep.