IMAGE

Fig 7

ID
ZDB-IMAGE-200829-88
Source
Figures for Zhang et al., 2020
Image
Figure Caption

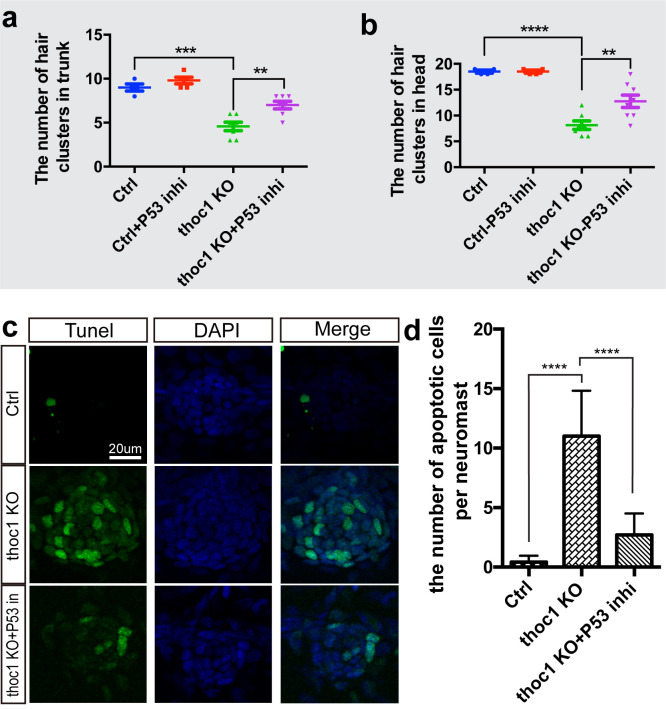
Fig 7 Inhibition of P53 signaling alleviated the <italic>thoc1</italic>-deficiency induced apoptosis in neuromasts.

(a, b) Statistical analysis of the hair cell clusters in control (n = 8), ctrl + P53 inhibitor treatment (n = 9), thoc1 KO (n = 8), and thoc1 KO + P53 inhibitor treatment embryos (n = 7). One-way ANOVA, ****, p<0.0001; ***, p<0.001; **, p<0.01. (c) TUNEL analysis of the neuromasts in control (n = 7), thoc1 KO (n = 7), and thoc1 KO + P53 inhibitor treatment embryos (n = 7). Green: TUNEL staining. Blue: DAPI staining of the cell nuclei. (d) Statistical analysis of the number of apoptotic cells per neuromast in control, thoc1 KO, and thoc1 KO + P53 inhibitor treatment embryos. One-way ANOVA, ****, p<0.0001.

Figure Data
Acknowledgments
This image is the copyrighted work of the attributed author or publisher, and ZFIN has permission only to display this image to its users. Additional permissions should be obtained from the applicable author or publisher of the image. Full text @ PLoS Genet.