IMAGE

Fig. 6.

ID
ZDB-IMAGE-200703-7
Genes
Source
Figures for Anderson et al., 2020
Image
Figure Caption

Fig. 6.

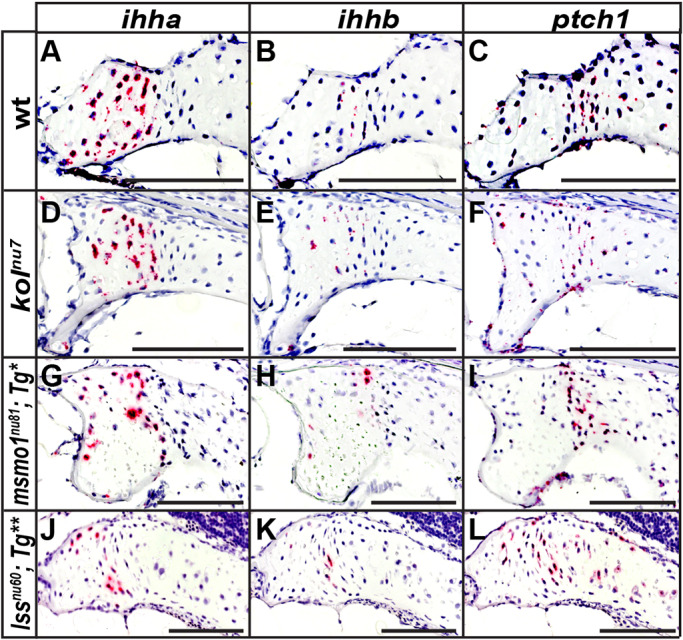
Ihh signaling within endochondral growth plates is present despite loss of Msmo1 and Lss activity. (A-L) Expression domains of ihha (A,D,G,J), ihhb (B,E,H,K) and ptch1 (C,F,I,L) were analyzed within growth plates of wild type (A-C), kolnu7 (D-F), Tg(fabp10a:msmo1:pA)nu100;msmo1nu81 (G-I) and Tg(fabp10:lss:pA)nu101;lssnu60 (J-L) using RNAscope in situ hybridization. (A-C) In wild type, expression of ihha and ihhb is observed in the pre-hypertrophic chondrocyte zone, with ptch1 expression seen to either side of these domains. (D-L) Expression of ihha, ihhb and ptch1 is present within mutant growth plates and similar to domains observed in wild type. Images represent paraffin sections of the pterotic at 2 months of age (∼15 mm SL). Scale bars: 100 μm. Tg*, Tg(fabp10:msmo1:pA)nu100; Tg**, Tg(fabp10:lss:pA)nu101. wt n=3, kolnu7 n=3, kolnu7/+:msmolnu81/+ n=3, Tg(fabp10a:msmo1:pA)nu100;msmo1nu81 n=3, Tg(fabp10:lss:pA)nu101;lssnu60 n=3.

Figure Data
Acknowledgments
This image is the copyrighted work of the attributed author or publisher, and ZFIN has permission only to display this image to its users. Additional permissions should be obtained from the applicable author or publisher of the image. Full text @ Dis. Model. Mech.