IMAGE

Fig. 7

ID
ZDB-IMAGE-200523-27
Genes
Antibodies
Source
Figures for Saito et al., 2010
Image
Figure Caption

Fig. 7

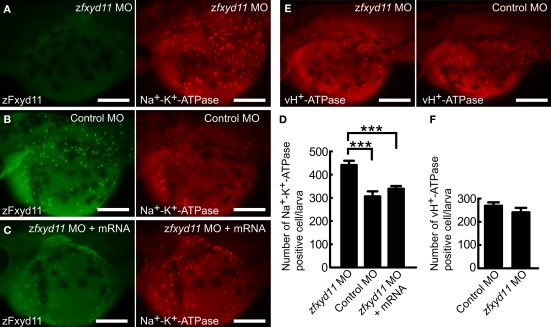
Effects of zFxyd11 knockdown. (A–C) Immunofluorescence staining was performed on zfxyd11-MO-injected (A), control-MO-injected (B), and zfxyd11-MO with zfxyd11a mRNA-injected larvae (C) with anti-zFxyd11 antiserum (green), along with anti–Na+–K+-ATPase antiserum (red). No signal for zFxyd11 was detected in zfxyd11 morphants (A). (D) The number of Na+–K+-ATPase–positive cells in the skin was counted and is represented as the mean ± SEM. Significant differences were evaluated by one-way ANOVA, Tukey's multiple comparison test (***p < 0.001, n = 7). (E) Immunofluorescence staining was performed on zfxyd11-MO-injected (left panel), control-MO-injected larvae (right panel) with anti–vH+-ATPase antiserum. (F) The number of vH+-ATPase–positive cells in the skin was counted and is represented as the mean ± SEM. The number of vH+-ATPase-positive cells was not affected by zFxyd11 knockdown (n = 7).

Figure Data
Acknowledgments
This image is the copyrighted work of the attributed author or publisher, and ZFIN has permission only to display this image to its users. Additional permissions should be obtained from the applicable author or publisher of the image. Full text @ Front. Physiol.