IMAGE

Fig. 7.

ID
ZDB-IMAGE-200509-41
Source
Figures for Veerman et al., 2019
Image
Figure Caption

Fig. 7.

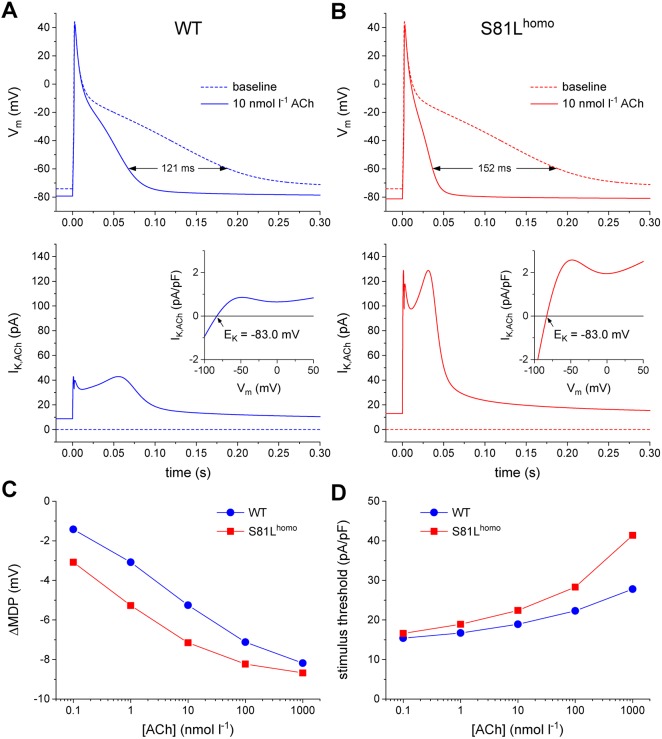
ACh induces more pronounced AP effects in S81Lhomo compared to WT human atrial myocytes in computer simulations. (A,B) APs elicited at 1 Hz (top panels) and associated IK,ACh (bottom panels) at baseline (dotted lines) and upon addition of 10 nmol l−1 ACh (solid lines) in WT (A) and S81Lhomo (B) human atrial myocytes. The horizontal double-headed arrow in panel A indicates the ACh-induced shortening of AP duration. The ‘wobbles’ in the time course of IK,ACh in panel B are caused by the N-shape of the IK,ACh current-voltage relationship (insets). The slanted arrows in the insets point to the IK,ACh reversal potential (EK) of −83.0 mV. (C,D) Shift in maximum diastolic potential (ΔMDP; C) and threshold stimulus current amplitude (D) at ACh concentrations ranging from 0.1 nmol l−1 to 1 µmol l−1. Note the logarithmic abscissa scale.

Acknowledgments
This image is the copyrighted work of the attributed author or publisher, and ZFIN has permission only to display this image to its users. Additional permissions should be obtained from the applicable author or publisher of the image. Full text @ Dis. Model. Mech.