IMAGE

Fig 4

ID
ZDB-IMAGE-200412-14
Source
Figures for Xie et al., 2020
Image
Figure Caption

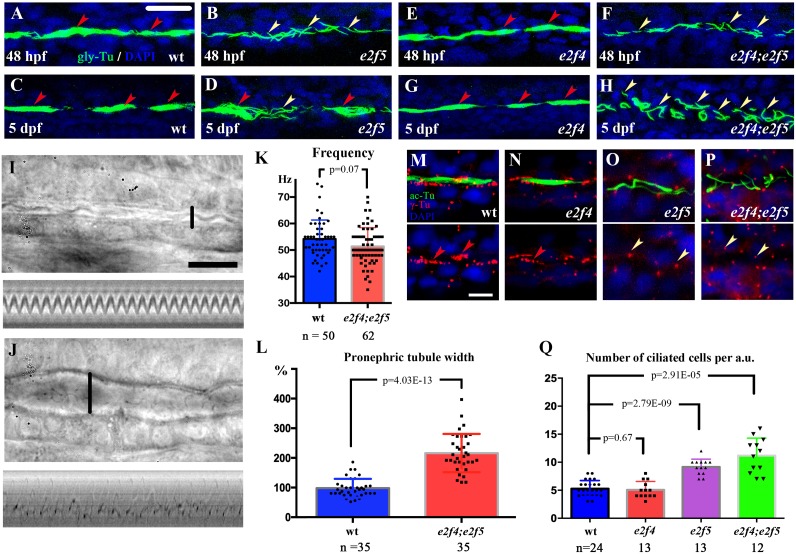
Fig 4 Multiciliogenesis defects in <italic>e2f5</italic> mutants.

(A-H) Confocal images showing cilia in the PST region of the pronephros of wild-type and mutant larvae at different stages as indicated. Cilia were visualized with anti-glycylated tubulin antibody in green. Nuclei were labeled with DAPI in blue. Red arrowheads indicate multicilia bundles and yellow arrowheads indicate single cilia. (I-J) Still images from S1 and S2 Movies showing cilia in the PST of 5dpf wild-type (I) and e2f4;e2f5 (J) double mutants. Bottom images show kymographs of cilia movement. (K) Beating frequency of cilia in the pronephric tubules of wild-type and e2f4; e2f5 double mutants. (L) Dot plot showing the width of pronephric tubule lumen as indicated by vertical lines in panel I and J. (M-P) Confocal images showing cilia and basal bodies labeled with anti-acetylated tubulin (ac-Tu, green) and anti-γ tubulin (γ-Tu, red) antibodies in the PST of 48 hpf wild-type and mutant larvae as indicated. Staining of γ-tubulin is also indicated in the bottom to show the multiple basal bodies of MCCs (red arrowheads) and single ciliary basal bodies (yellow arrowheads). (Q) The number of cells bearing motile cilia per arbitrary unit (a.u.) in the PST region of wild-type and mutant larvae as indicated. Scale bars: 25 μm in panels A-H, 10 μm in panels I, J and 5μm in panels M-P.

Figure Data
Acknowledgments
This image is the copyrighted work of the attributed author or publisher, and ZFIN has permission only to display this image to its users. Additional permissions should be obtained from the applicable author or publisher of the image. Full text @ PLoS Genet.