
|
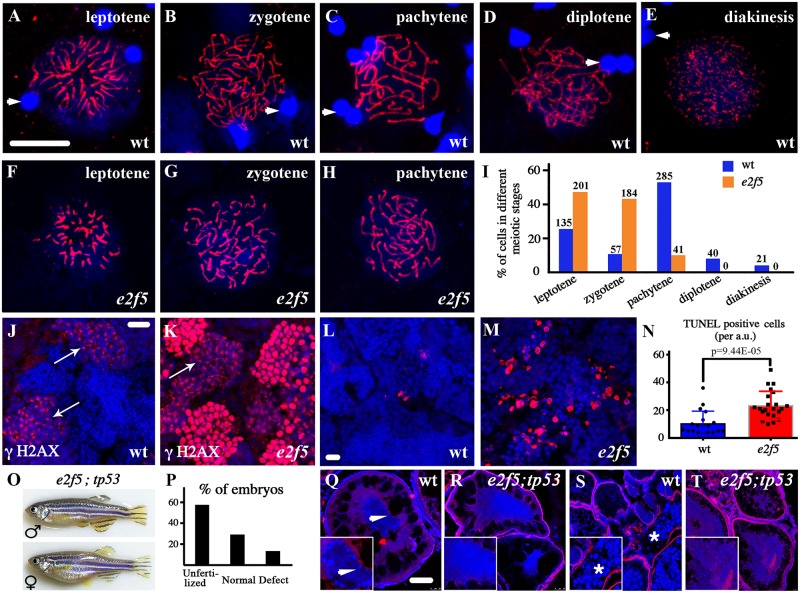
Fig 2
(A-H) Confocal images of primary spermatocytes at different prophase stages of meiosis I as indicated by anti-Sycp3 antibody staining (red). Arrowheads indicate spermatozoa nuclei from wild-type testis stained with DAPI in blue (A-E). (I) Bar graph showing the statistical results of the percentage of cells in different meiotic stages. The numbers of spermatocytes investigated are shown on top of each bar. (J-K) Staining of γH2AX (red) in the testes of wild-type and