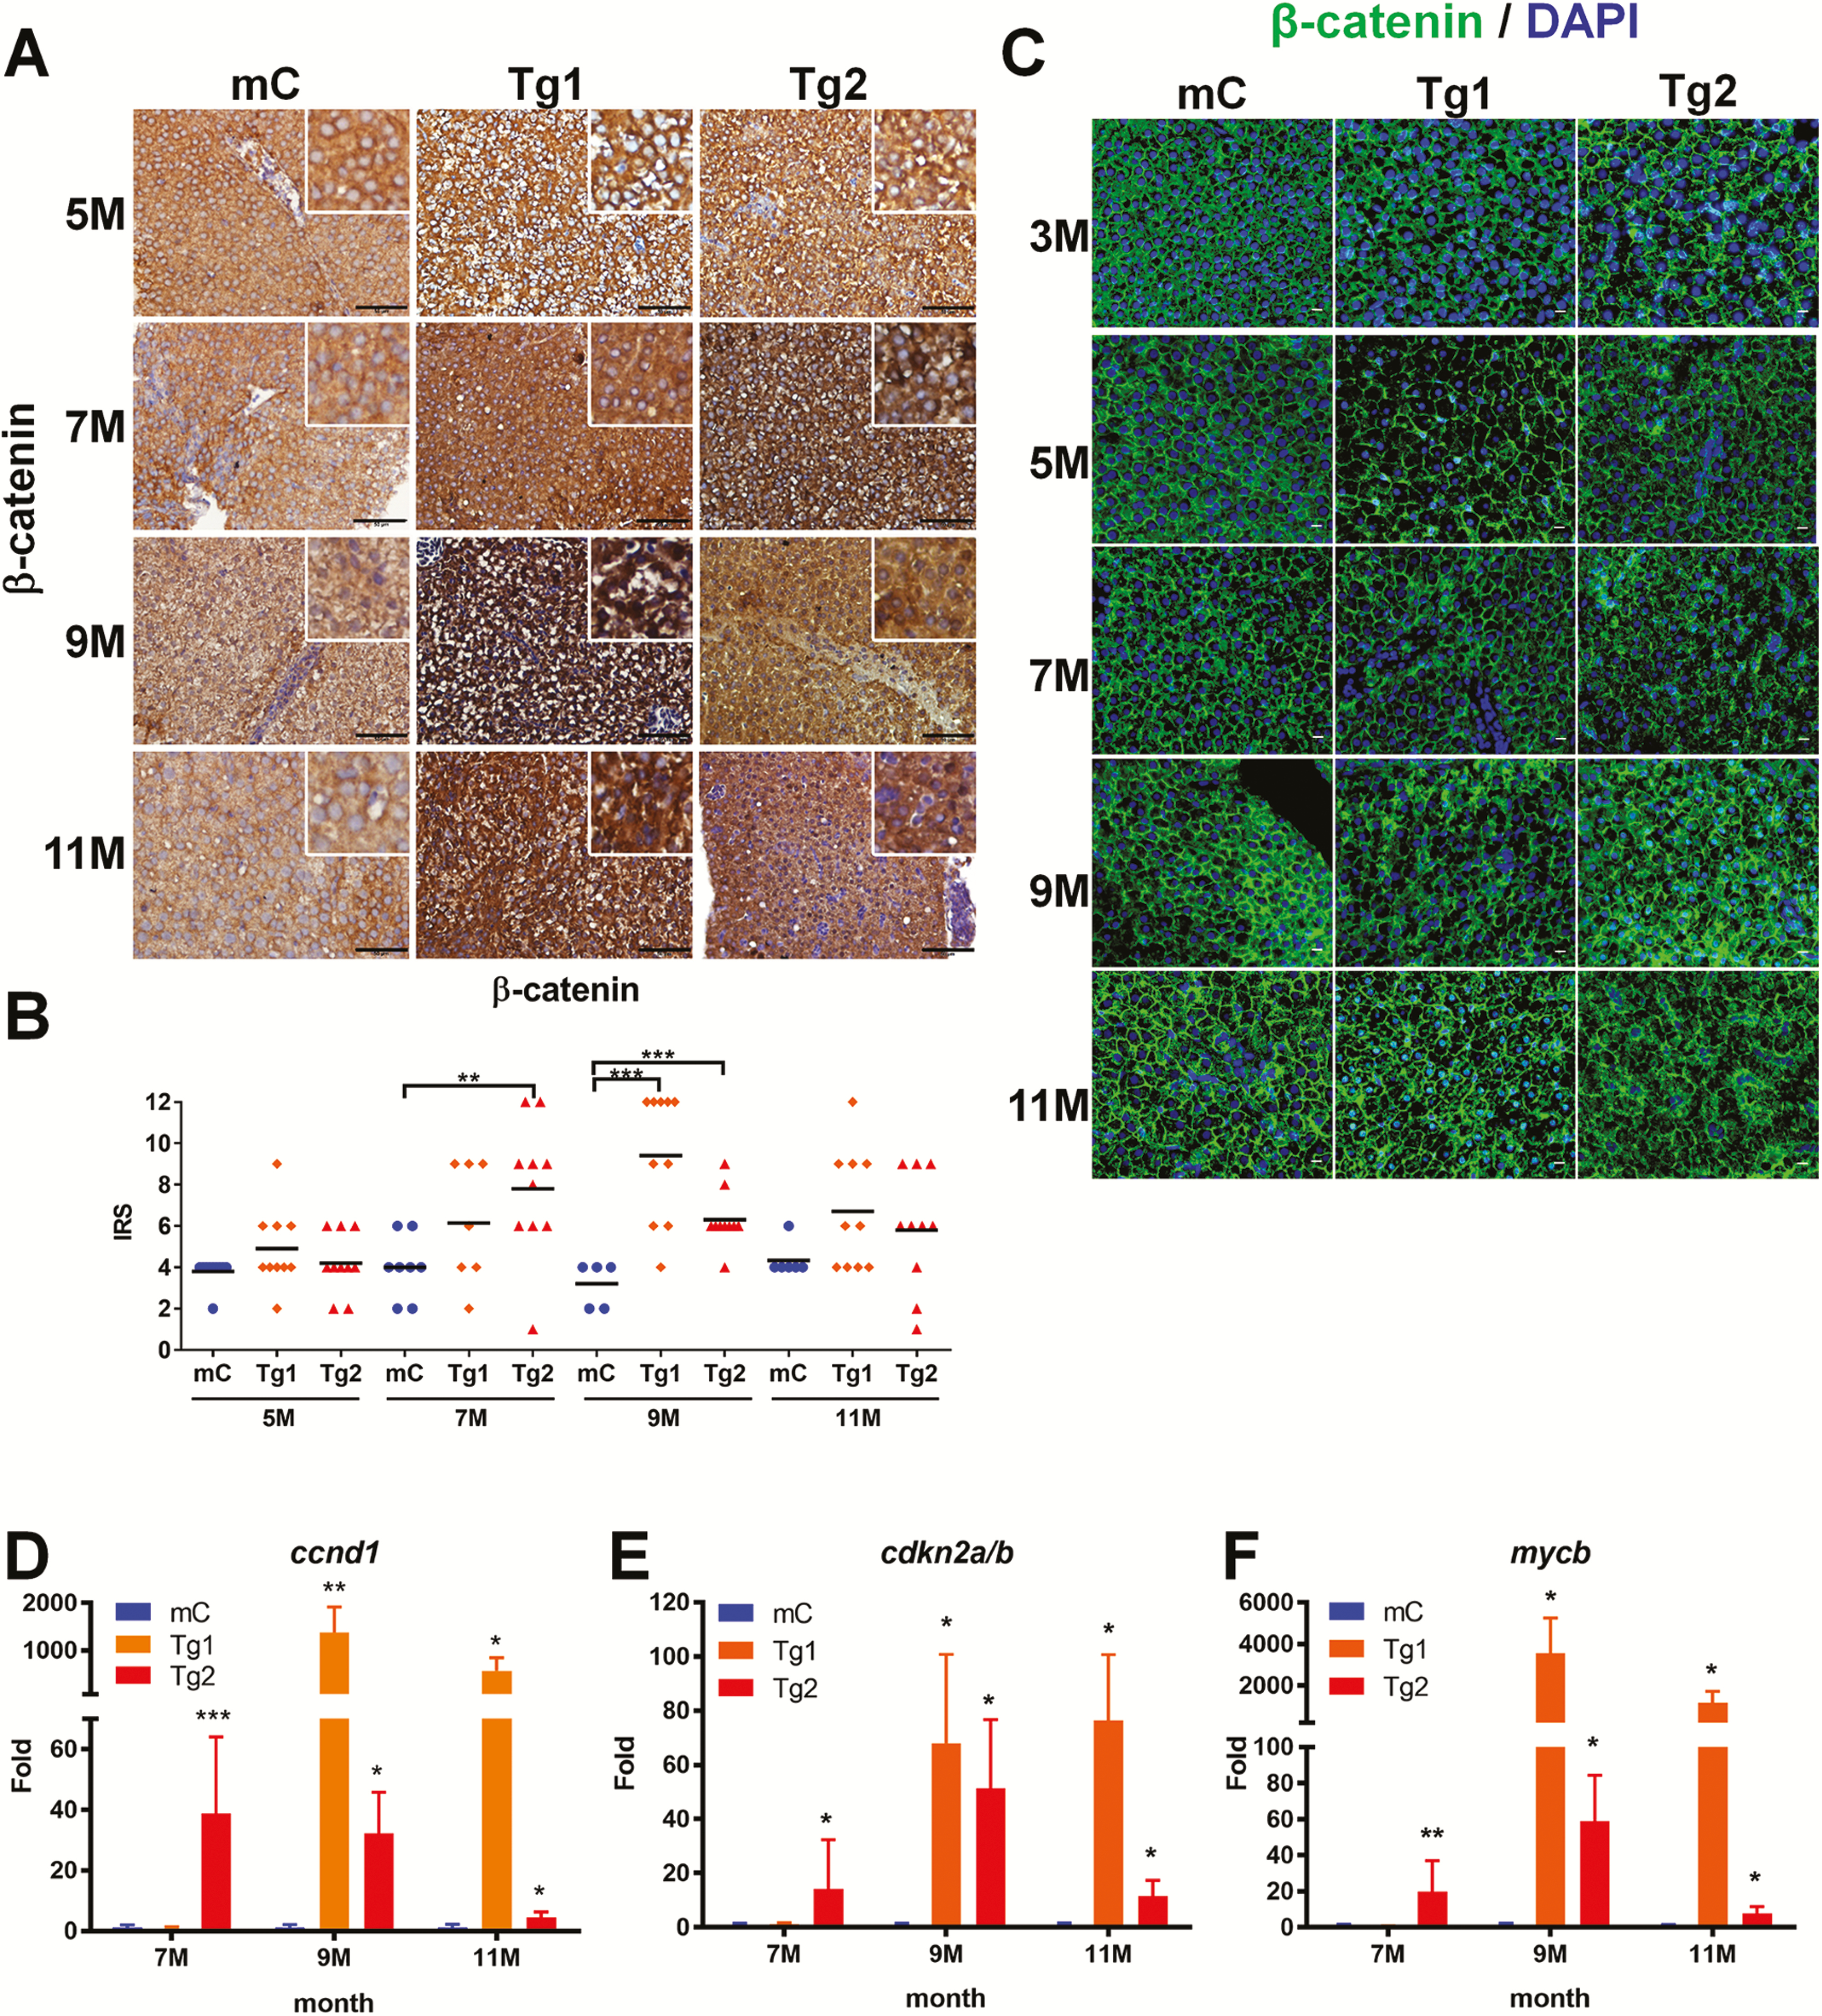
Fig. 5 The expression of ?-catenin and downstream target genes was upregulated in RPIA-transgenic fish aged 7?11 months. (A) Representative images of ?-catenin IHC staining from 5 to 11 months of control (mC), Tg1- and Tg2-RPIA-transgenic fish. A weaker ?-catenin signal was detected in transgenic, control tissues (mC) relative to tissues from the RPIA-transgenic fish, and staining in the control fish revealed expression in the area surrounding the nucleus. In the 9 and 11 months of Tg (fabp10a: RPIA) fish lines, the amount of ?-catenin in nucleus was upregulated. All of the magnifications were ×400. Scale bar: 50 ?m. (B) Statistical analysis of ?-catenin immunostaining in 5- to 11-month-old Tg1- and Tg2-RPIA-transgenic fish compared with control. Statistical analysis was performed by unpaired two-tailed t-tests. Asterisks (*) represent the level of significance. *P < 0.05 was considered statistically significant. **P < 0.01; ***P < 0.001. N = 10 each stage. (C) Immunofluorescence staining of ?-catenin in Tg1- and Tg2-RPIA-transgenic zebrafish compared with control (mC). The images showed that ?-catenin (green) lost the expression for cell junction and co-localized with DAPI (blue) within nucleus in RPIA-transgenic zebrafish liver. All of the magnifications were ×400. Scale bar: 40 ?m. (D?F) QPCR was used to measure the induction of the ?-catenin target genes ccnd1 (D), cdkn2a/b (E), and mycb (F) in two independent lines of Tg (fabp10a: RPIA), which compared with control fish (mC) aged 3, 5, 7, 9 and 11 months. A significant increase in the expression levels of ?-catenin target genes was found in 9- to 11-month-old Tg1 and 7- to 9-month-old Tg2 transgenic fish as compared with the transgenic control fish (mCherry). Statistical analysis was performed by unpaired two-tailed t-tests. Asterisks (*) represent the level of significance. *P < 0.05 was considered statistically significant. **P < 0.01; ***P < 0.001. N = 10 each stage.
Image
Figure Caption
Figure Data
Acknowledgments
This image is the copyrighted work of the attributed author or publisher, and
ZFIN has permission only to display this image to its users.
Additional permissions should be obtained from the applicable author or publisher of the image.
Full text @ Carcinogenesis

