Fig. 1
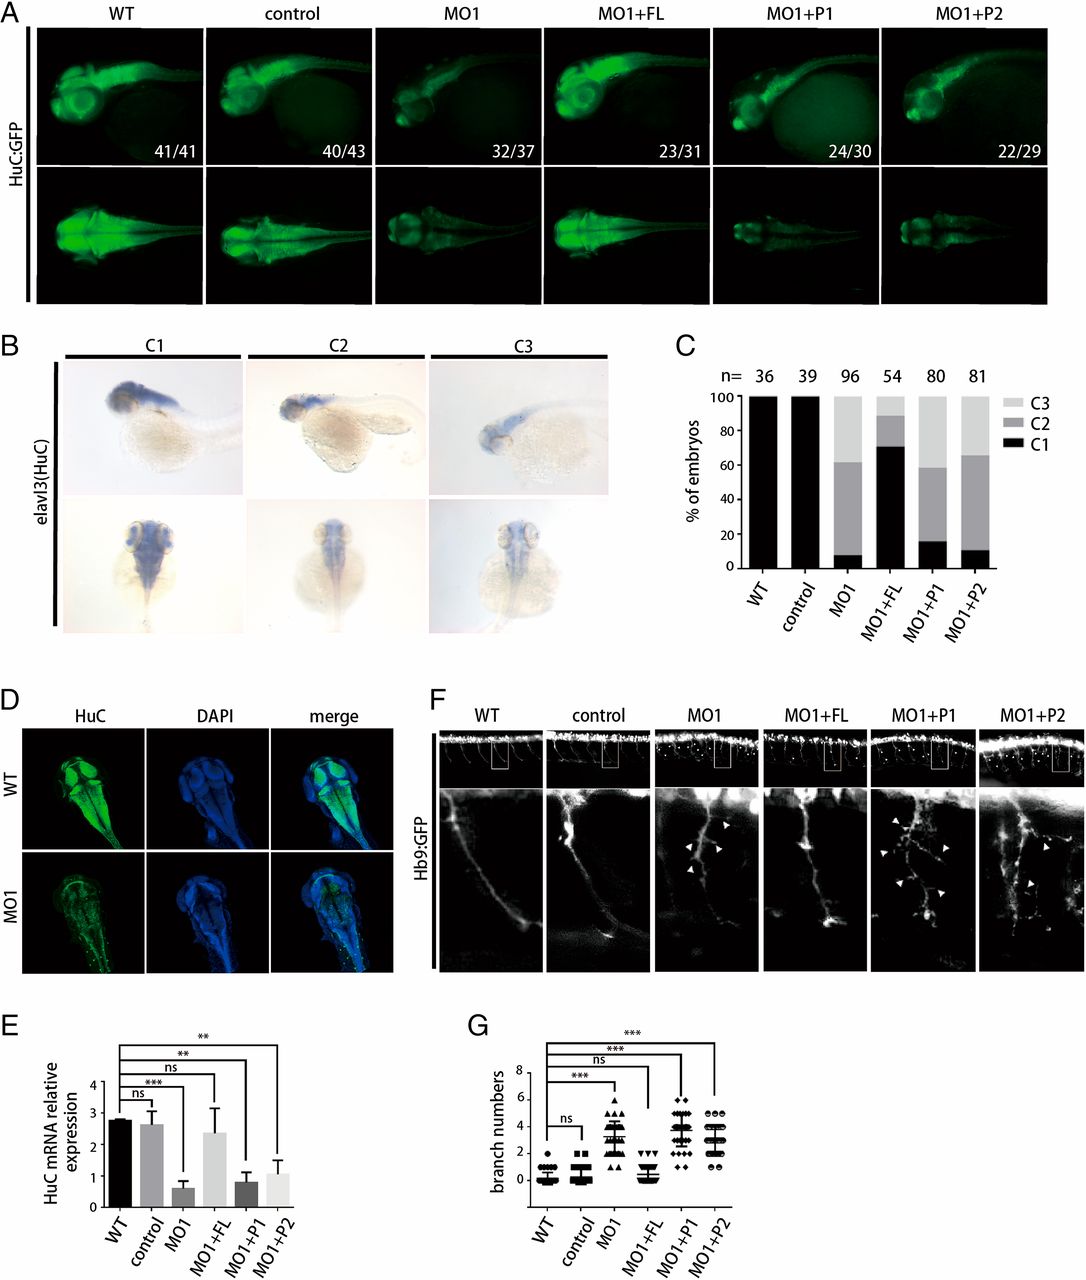
The TBC1D23 C terminus is critical for Zebrafish neuronal development and brain growth. (A) HuC (green) expression in Tg [HuC: GFP] transgenic zebrafish. WT, wild type; control, control MO injection; MO1, MO1 injection; MO1+FL, MO1 and full-length human TBC1D23 mRNA coinjection; MO1+P1, MO1 and P1 mRNA coinjection; MO1+P2, MO1 and P2 mRNA coinjection. P1 and P2 stand for 2 TBC1D23 mutations found in patients. P1 is a 2-base pair deletion (c.1475_1476delTG, NM_001199198.2) in the TBC1D23 gene, resulting in a frameshift, and a protein truncated the C terminus (Val492GlyfsTer8). P2 skips the exon 16, and encodes a truncated protein (His534TrpfsTer36). All injections are performed at one-cell stage of the development. (Top) Lateral views; (Bottom) dorsal views. (B) Classification of zebrafish embryos based on the expression level of HuC (elavl3) at 48 hpf. C1, normal; C2, moderately decreased; C3, significantly lost. (Top) Lateral views; (Bottom) dorsal views. (C) The percentage of embryos in each class upon injection of MO1 or coinjection of mRNAs. Experiments were at least triplicated for all zebrafish experiments, and n stands for the number of embryos used for statistical analysis. (D) Immunofluorescent staining with a 2-photon confocal microscope showing the effects on HuC (green) and DAPI (blue) of deleting TBC1D23. DAPI was used to label the entire head structure of zebrafish. Dorsal views. (E) Semi-quantitative RT-PCR analysis of the transcription level of HuC. Mean ± SEM; n = 3; ***P < 0.001; **P < 0.01; ns, not significant. P values were calculated using one-way ANOVA, Tukey?s multiple comparisons test, throughout the paper unless otherwise indicated. (F) Morphology of CaP axons from embryos at 48 hpf that were injected with MO1 and/or different mRNA. All injections are performed at one-cell stage of the Tg [hb9: GFP]ml2 transgenic zebrafish embryos. Arrows indicate abnormal branches. Lateral views and enlarged views are shown. Rectangles in Top are shown in Bottom. (G) Statistical results of the branch number of CaP axons in embryos were treated as in F. For each group, 40 axons from 8 Tg [hb9: GFP]ml2 transgenic zebrafish embryos are scored. Experiments were repeated 3 times. ***P < 0.001.

