(A) Phenotypes of npm (A1) and CRISPR-Cas9 induced frameshift mutations in galr1A (A2), galn (A4), and a trans-heterozygous fish galr1A/npm (A3) (see also Figures S2, S3, and S4).
(B) T4 thyroid hormone levels measured in wild-type, galn, and npm mutants (mean ± SD, n = 6 for WT, n = 5 for galn, n = 4 for npm).
(C–E) Relative transcript abundance for
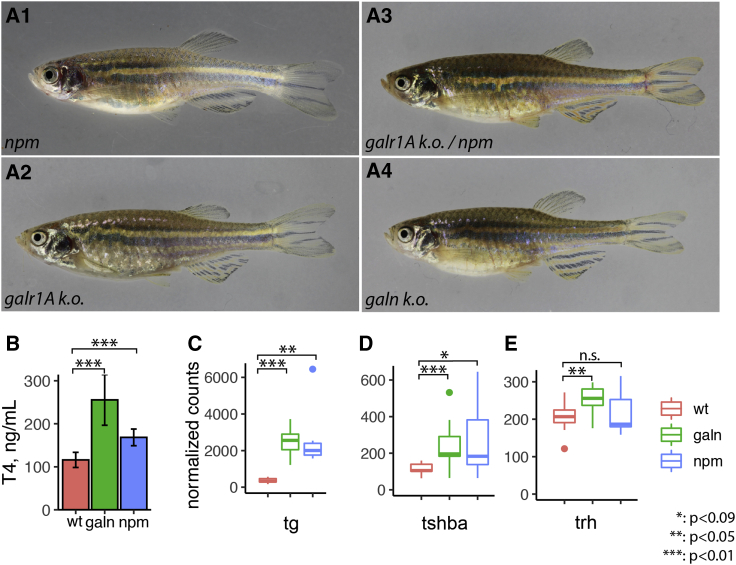
 thyroglobulin (tg; C), thyroid-stimulating hormone (tshba; D), and thyrotropin-releasing hormone (trh; E) in the heads of galn (n = 8) and npm (n = 7) mutant fish compared to wild-type (n = 9). The plots depict the mean values (horizontal line), the first and third quartiles (box), and the lowest and highest values no further than 1.5 × IQR (interquartile range) from the hinge (whiskers); outliers are plotted as individual points (∗p < 0.09; ∗∗p < 0.05; ∗∗∗p < 0.01; n.s., not significant).
This image is the copyrighted work of the attributed author or publisher, and
ZFIN has permission only to display this image to its users.
Additional permissions should be obtained from the applicable author or publisher of the image.
Full text @ Curr. Biol.
Your Input Welcome
Thank you for submitting comments. Your input has been emailed to ZFIN curators who may contact you if
additional information is required.
Oops. Something went wrong. Please try again later.