IMAGE

Fig. 1

ID
ZDB-IMAGE-200130-1
Source
Figures for Huning et al., 2020
Image
Figure Caption

Fig. 1

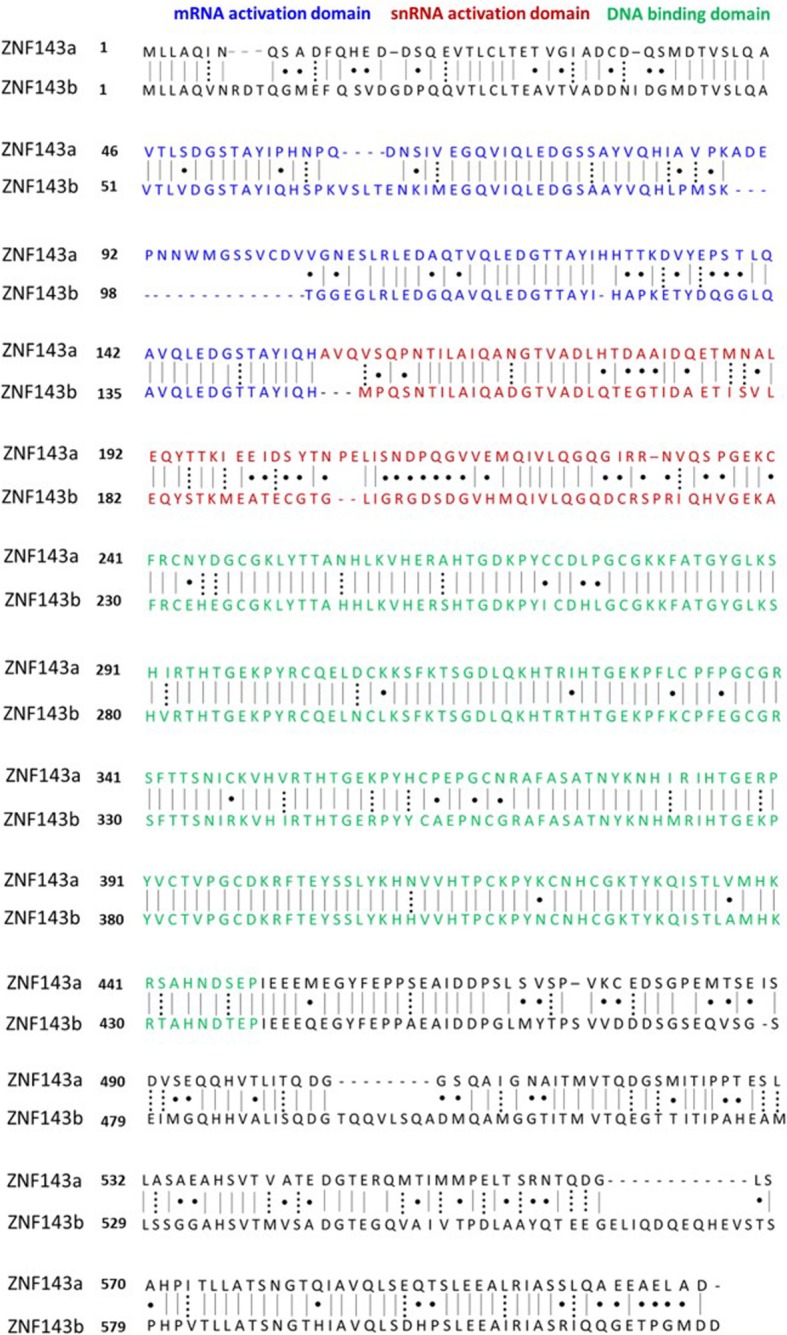
Amino acid sequence alignment of zebrafish ZNF143a vs. ZNF143b. Protein sequences of ZNF143a and ZNF143b were aligned with the lalign sequence analysis program using the algorithm of Huang and Miller [19]. Identical amino acids are indicated by a straight line, similar amino acids are indicated by a dotted line, and dissimilar amino acids are indicated by a single dot. Amino acids within the DNA binding domain are colored green, amino acids within the mRNA activation region are colored blue, and amino acids within the snRNA gene activation region are colored red

Acknowledgments
This image is the copyrighted work of the attributed author or publisher, and ZFIN has permission only to display this image to its users. Additional permissions should be obtained from the applicable author or publisher of the image. Full text @ BMC Mol Cell Biol