Fig. 1
Fig. 1
H2O2 Production and Scavenging and Lipid Peroxidation Dynamic during Retinal Development
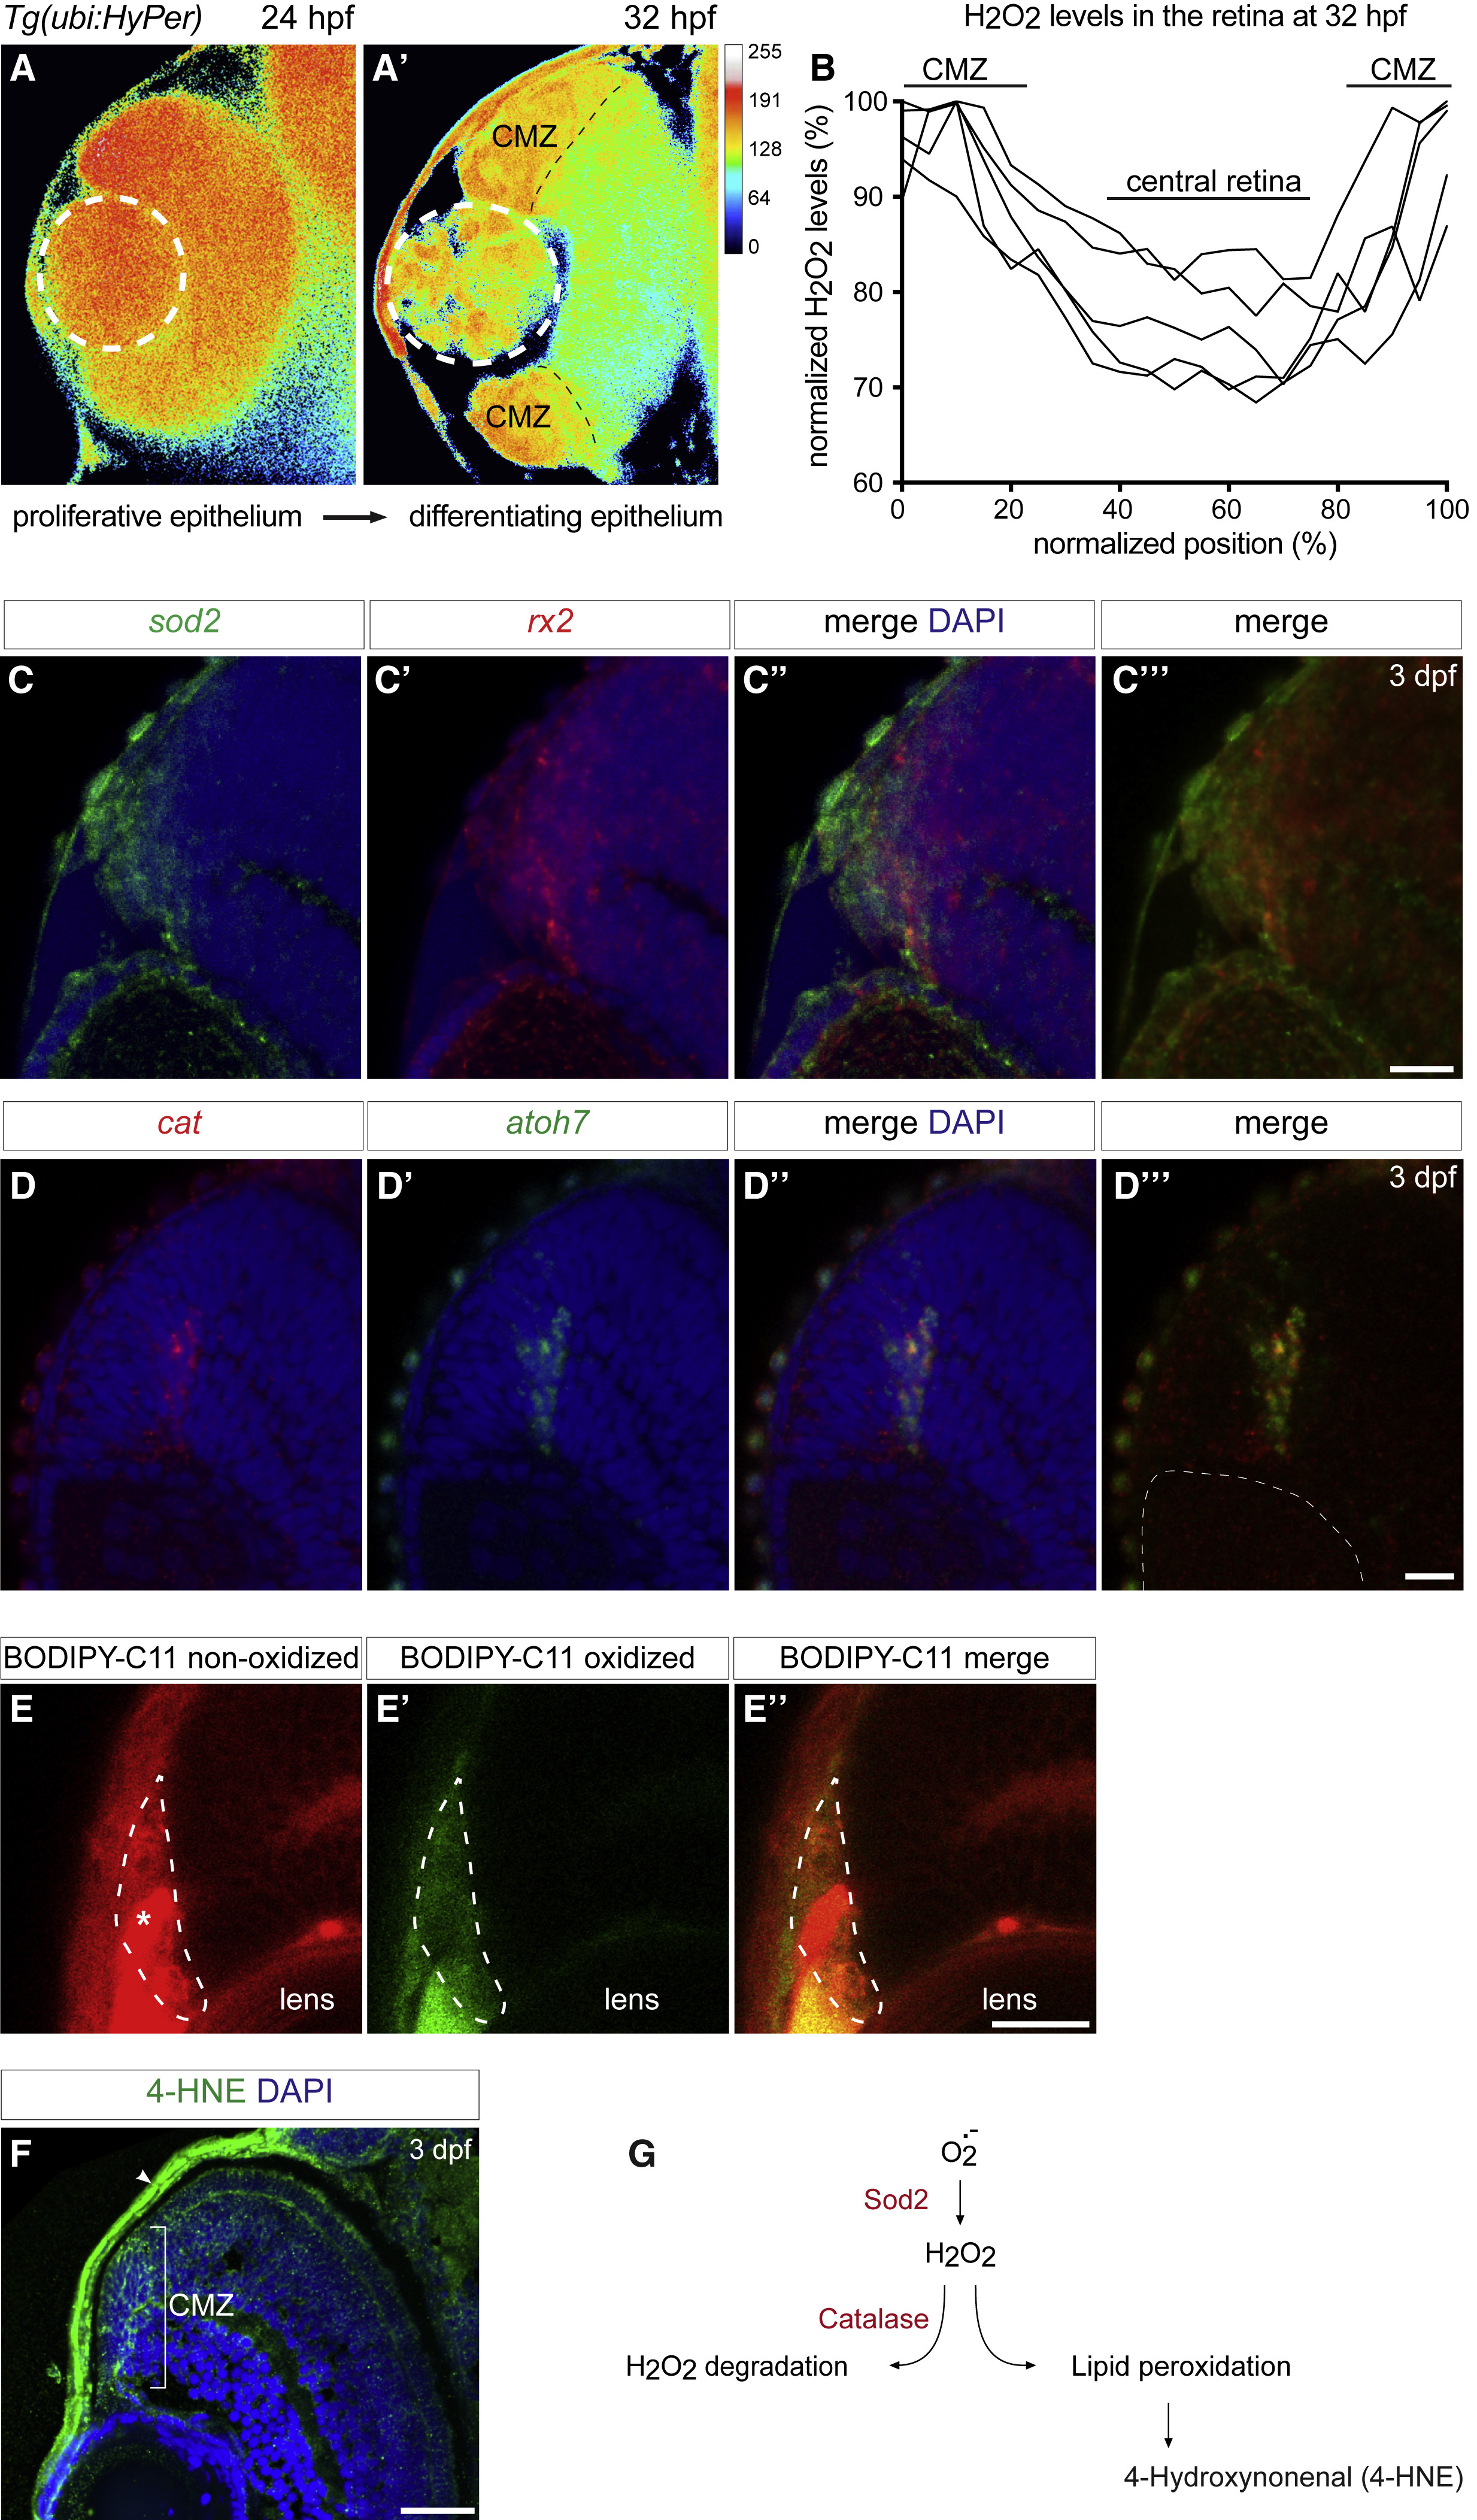
(A–B) H2O2 levels change in relation to retinal development revealed by the reporter line Tg(ubi:HyPer). The H2O2 levels are inferred from the YFP500 over YFP420 excitation ratio of HyPer. (A) and (A’) Optical section of a Tg(ubi:HyPer) retina at 24 hpf shows homogeneous high levels of H2O2 throughout the proliferative epithelium. At 32 hpf, H2O2 content decreased in the central part of the tissue and remained high in the ciliary marginal zone (CMZ) as confirmed by normalized quantification of H2O2 levels at this stage (B).
(C–C’’’) Sod2 is expressed in stem and retinal progenitor cells within the domain of rx2 at 3 days postfertilization (dpf). Confocal sections through the central retina of wild-type embryos hybridized with both sod2 (green) and rx2 (red) antisense RNA probes.
(D–D”’) Catalase is expressed in the domain of atoh7 in cycling retinal progenitor cells at 3 dpf. Confocal sections through the central retina of wild-type embryos hybridized with both catalase (red) and atoh7(green) antisense RNA probes. Retinae were counterstained with the nuclear marker DAPI (blue). White dashed lines delimitate the lens.
(E–E”) Lipid peroxidation induced by ROS was detected using the BODIPY-C11 probe. Frontal confocal optical section of 3 dpf retinae treated with BODIPY-C11. (E) Non-oxidized BODIPY-C11 is shown in red and could be detected in the entire retinal tissue and enriched in the blood vessel adjacent to the retina (asterisk). (E′) Oxidized BODIPY-C11 is shown in green and was only detected at the outermost edge of the CMZ surrounded by white dashed lines. The merge is shown in (E”).
(F) The lipid peroxidation end marker 4-HNE was found enriched in the CMZ of the 3 dpf zebrafish retina as revealed by immunohistochemistry (green) on 3 dpf frontal retinal cryosection counterstained with DAPI (blue). The white arrow points at 4-HNE staining at the surface of the skin where high oxidative stress processing occurs as expected.
Scale bars: 20 μm in (C)–(C’’’), (D)–(D”’), and (E)–(E”) and 100 μm in (F).
(G) Schematic representation of H2O2 scavenging via catalase coupled with the lipid peroxidation pathway and the downstream production of 4-HNE as secondary messenger.
Reprinted from Developmental Cell, 50(1), Albadri, S., Naso, F., Thauvin, M., Gauron, C., Parolin, C., Duroure, K., Vougny, J., Fiori, J., Boga, C., Vriz, S., Calonghi, N., Del Bene, F., Redox Signaling via Lipid Peroxidation Regulates Retinal Progenitor Cell Differentiation, 73-89.e6, Copyright (2019) with permission from Elsevier. Full text @ Dev. Cell

