
Fig. 5
|
Fig. 5
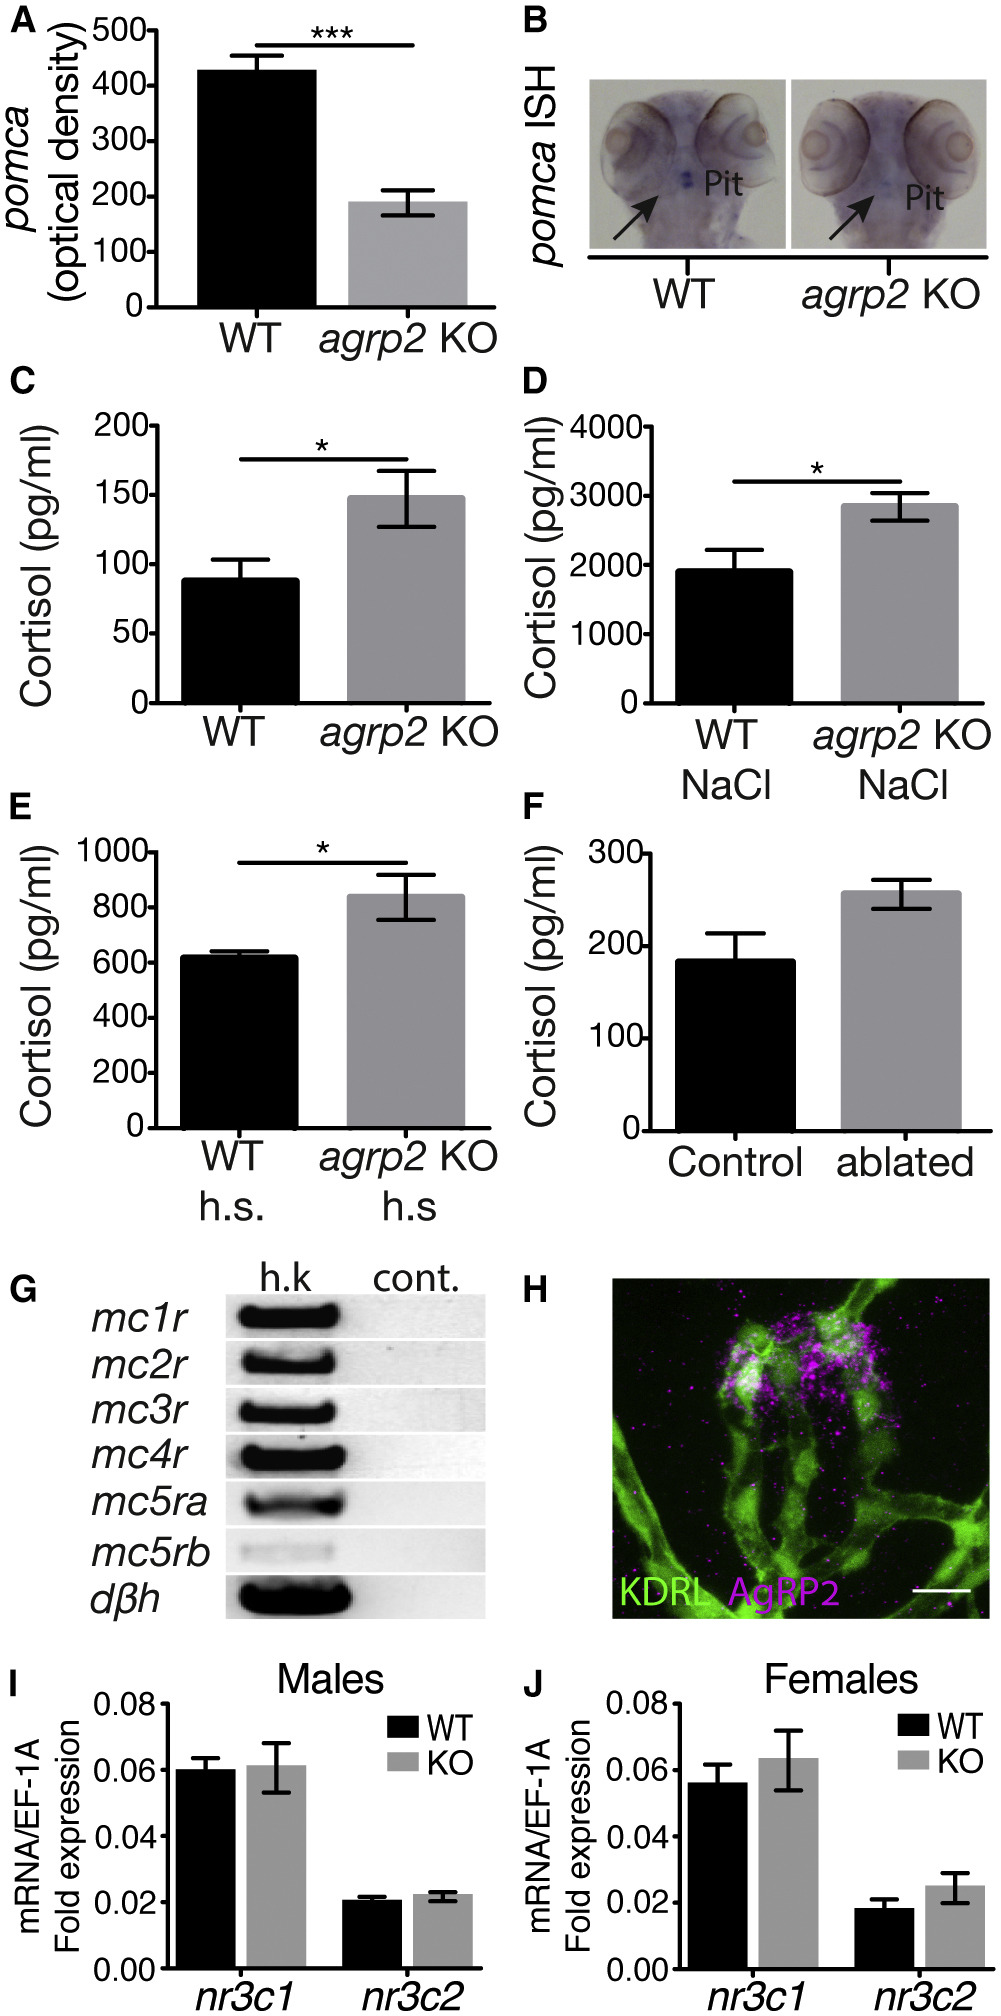
AgRP2 Is a Regulator of the Stress Axis
(A) ISH analysis of pituitary pomca mRNA expression. pomca is significantly decreased in agrp2 KOs in comparison to their WT controls (t test; n = 22; p < 0.001). Values represent the mean optical density ± SE.
(B) Representative pomca ISH signals of agrp2 KO and WT control.
(C) Basal state cortisol levels were measured in agrp2 KOs and their WT controls (t test; n = 6; p < 0.05). Values represent the mean cortisol levels ± SE.
(D) Cortisol levels of agrp2 KOs and their WT controls after 10 min of osmotic shock (250 mM NaCl; t test; n = 6; p < 0.05). Values represent the mean cortisol levels ± SE.
(E) Cortisol levels of agrp2 KOs and their WT controls after 10 min of 36°C heat shock (h.s.) (t test; n = 6; p < 0.05). Values represent the mean cortisol levels ± SE.
(F) Cortisol levels of AgRP2-ablated larvae and their controls (t test; n = 6; p = 0.056). Values represent the mean cortisol levels ± SE.
(G) PCR analysis of melanocortin receptor expression in the head kidney, where the interrenal tissue is located. Dopamine beta hydroxylase (dβh) was used as a positive control for interrenal tissue cells. h.k., head-kidney; cont., negative control.
(H) Immunostaining analysis of the pituitary vasculature using the zebrafish-specific AgRP2 antibody (magenta) and EGFP antibody in kdrl:EGFP larvae (green), which expresses EGFP in vascular endothelial cells. Scale bar represents 10 μm.
(I) Real-time PCR analysis of glucocorticoid receptor or mineralocorticoid receptor expression in male pituitary glands, encoded by the nr3c1 and nr3c2, respectively (t test; n = 8; p > 0.05).
(J) Real-time PCR analysis of glucocorticoid receptor or mineralocorticoid receptor expression in female pituitary glands, encoded by the nr3c1 and nr3c2, respectively (t test; n = 8; p > 0.05).