IMAGE

Fig. 4.

ID
ZDB-IMAGE-190723-2003
Genes
Source
Figures for Reuter et al., 2019
Image
Figure Caption

Fig. 4.

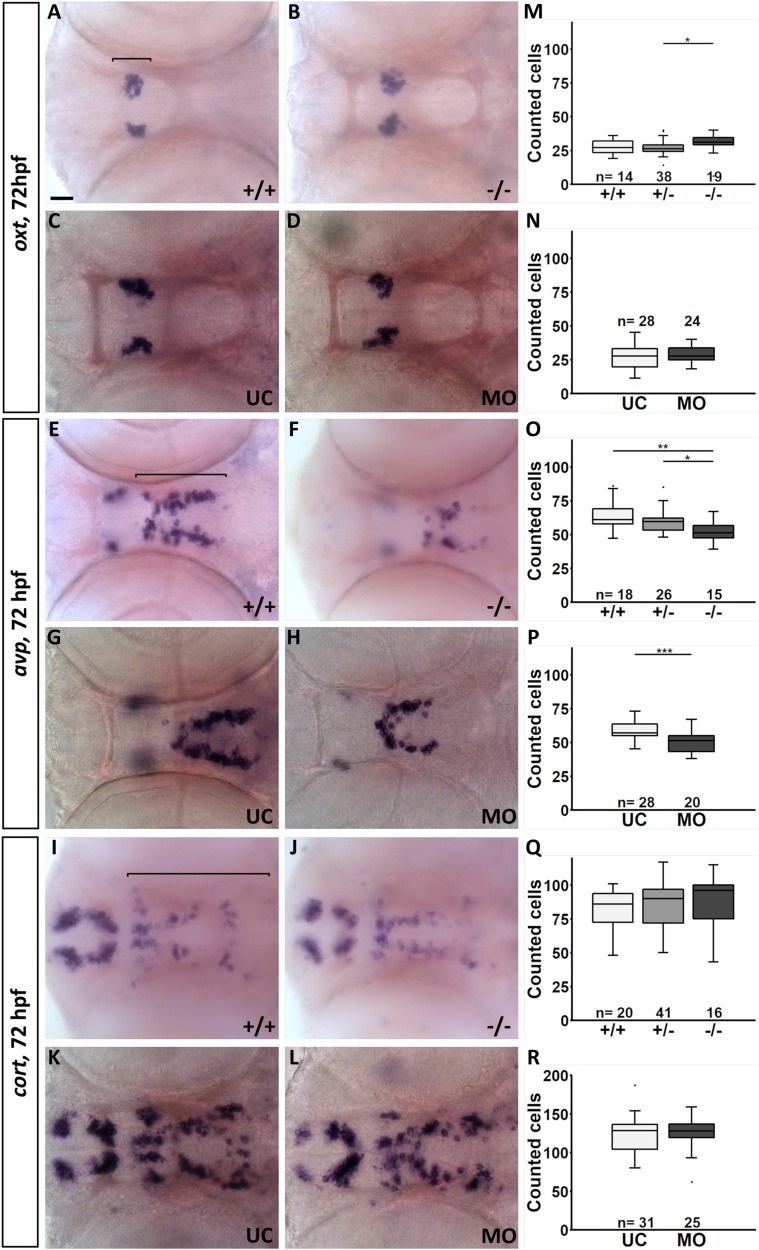
Quantification of the number of oxt-,avp- and cort-expressing cells in the hypothalamus of fgf3t24152 mutants and fgf3 morphants at 72 hpf. (A–L) Light microscopic pictures of wild type (+/+) and homozygous fgf3t24152 mutant (−/−) siblings as well as fgf3 morphants (MO) and uninjected control siblings (UC) processed for RNA in situ hybridisation. The posterior cells expressing avp are more affected by impaired fgf3 than the anterior ones. Ventral views, anterior to the left. Scale bar: 30 µm. (M–R) Quantifications of oxt-, avp- and cort-positive cells in fgf3t24152 mutants, fgf3 morphants and control siblings. Cell clusters used for the analyses are indicated by the lines in A, E and I. Tukey boxplots show median, 25–75% percentile, IQR whiskers and outliers. n=number of analysed individuals, +/−, heterozygous fgf3t24152 mutants. *P>0.05, **P>0.01, ***P>0.001.

Figure Data
Acknowledgments
This image is the copyrighted work of the attributed author or publisher, and ZFIN has permission only to display this image to its users. Additional permissions should be obtained from the applicable author or publisher of the image. Full text @ Biol. Open