
|
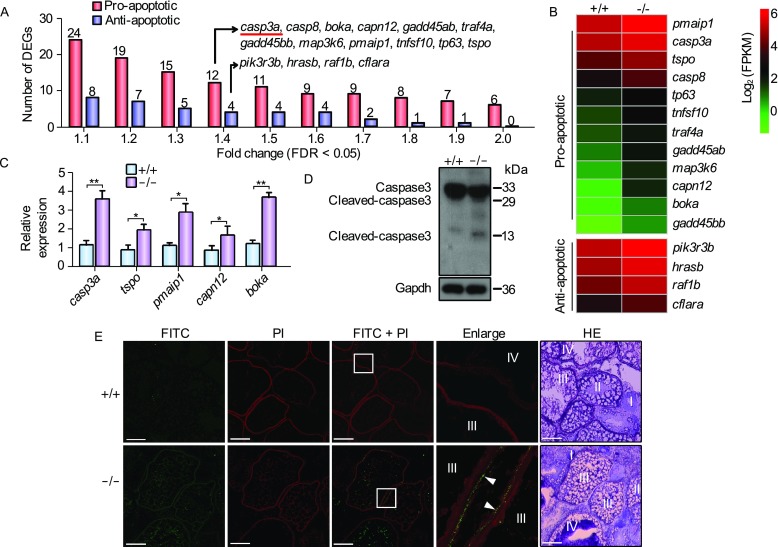
Figure 4
Up-regulated apoptosis in the sox3−/− ovaries in comparison with wild type ovaries. (A) Statistical analysis of the apoptosis-related DEGs (FDR < 0.05) in both sox3+/+ and sox3−/−based on KEGG analysis. Red bars indicated pro-apoptotic genes and blue bars represented anti-apoptotic genes. The genes with fold change of 1.4 were listed. (B) Hierarchical clustering indicated the expression levels of apoptosis-related DEGs between sox3+/+ and sox3−/− ovaries. (C) Quantitative real-time PCR analysis of selected genes to validate the DEGs from RNA-seq data. The transcript levels were related to β-actin expression. Relative level, 2−ΔΔCt. T-test was performed. *P< 0.05; **P < 0.01. (D) Western blot analysis showed that cleaved-caspase3 were up-regulated in the sox3−/− ovaries in comparison with the wild type ovaries. Gapdh was used as an internal control. (E) TUNEL analysis. In follicles of stages III and IV, obvious signals (FITC-labeled, green) were observed in somatic cells (theca cells and granulosa cells) (white arrowheads) of sox3−/− ovaries. The nuclei were stained by PI (red). The enlarged images originated from the white squares. The ovaries sections were stained by H.E. and showed on the right. Scale bar: 100 µm