
|
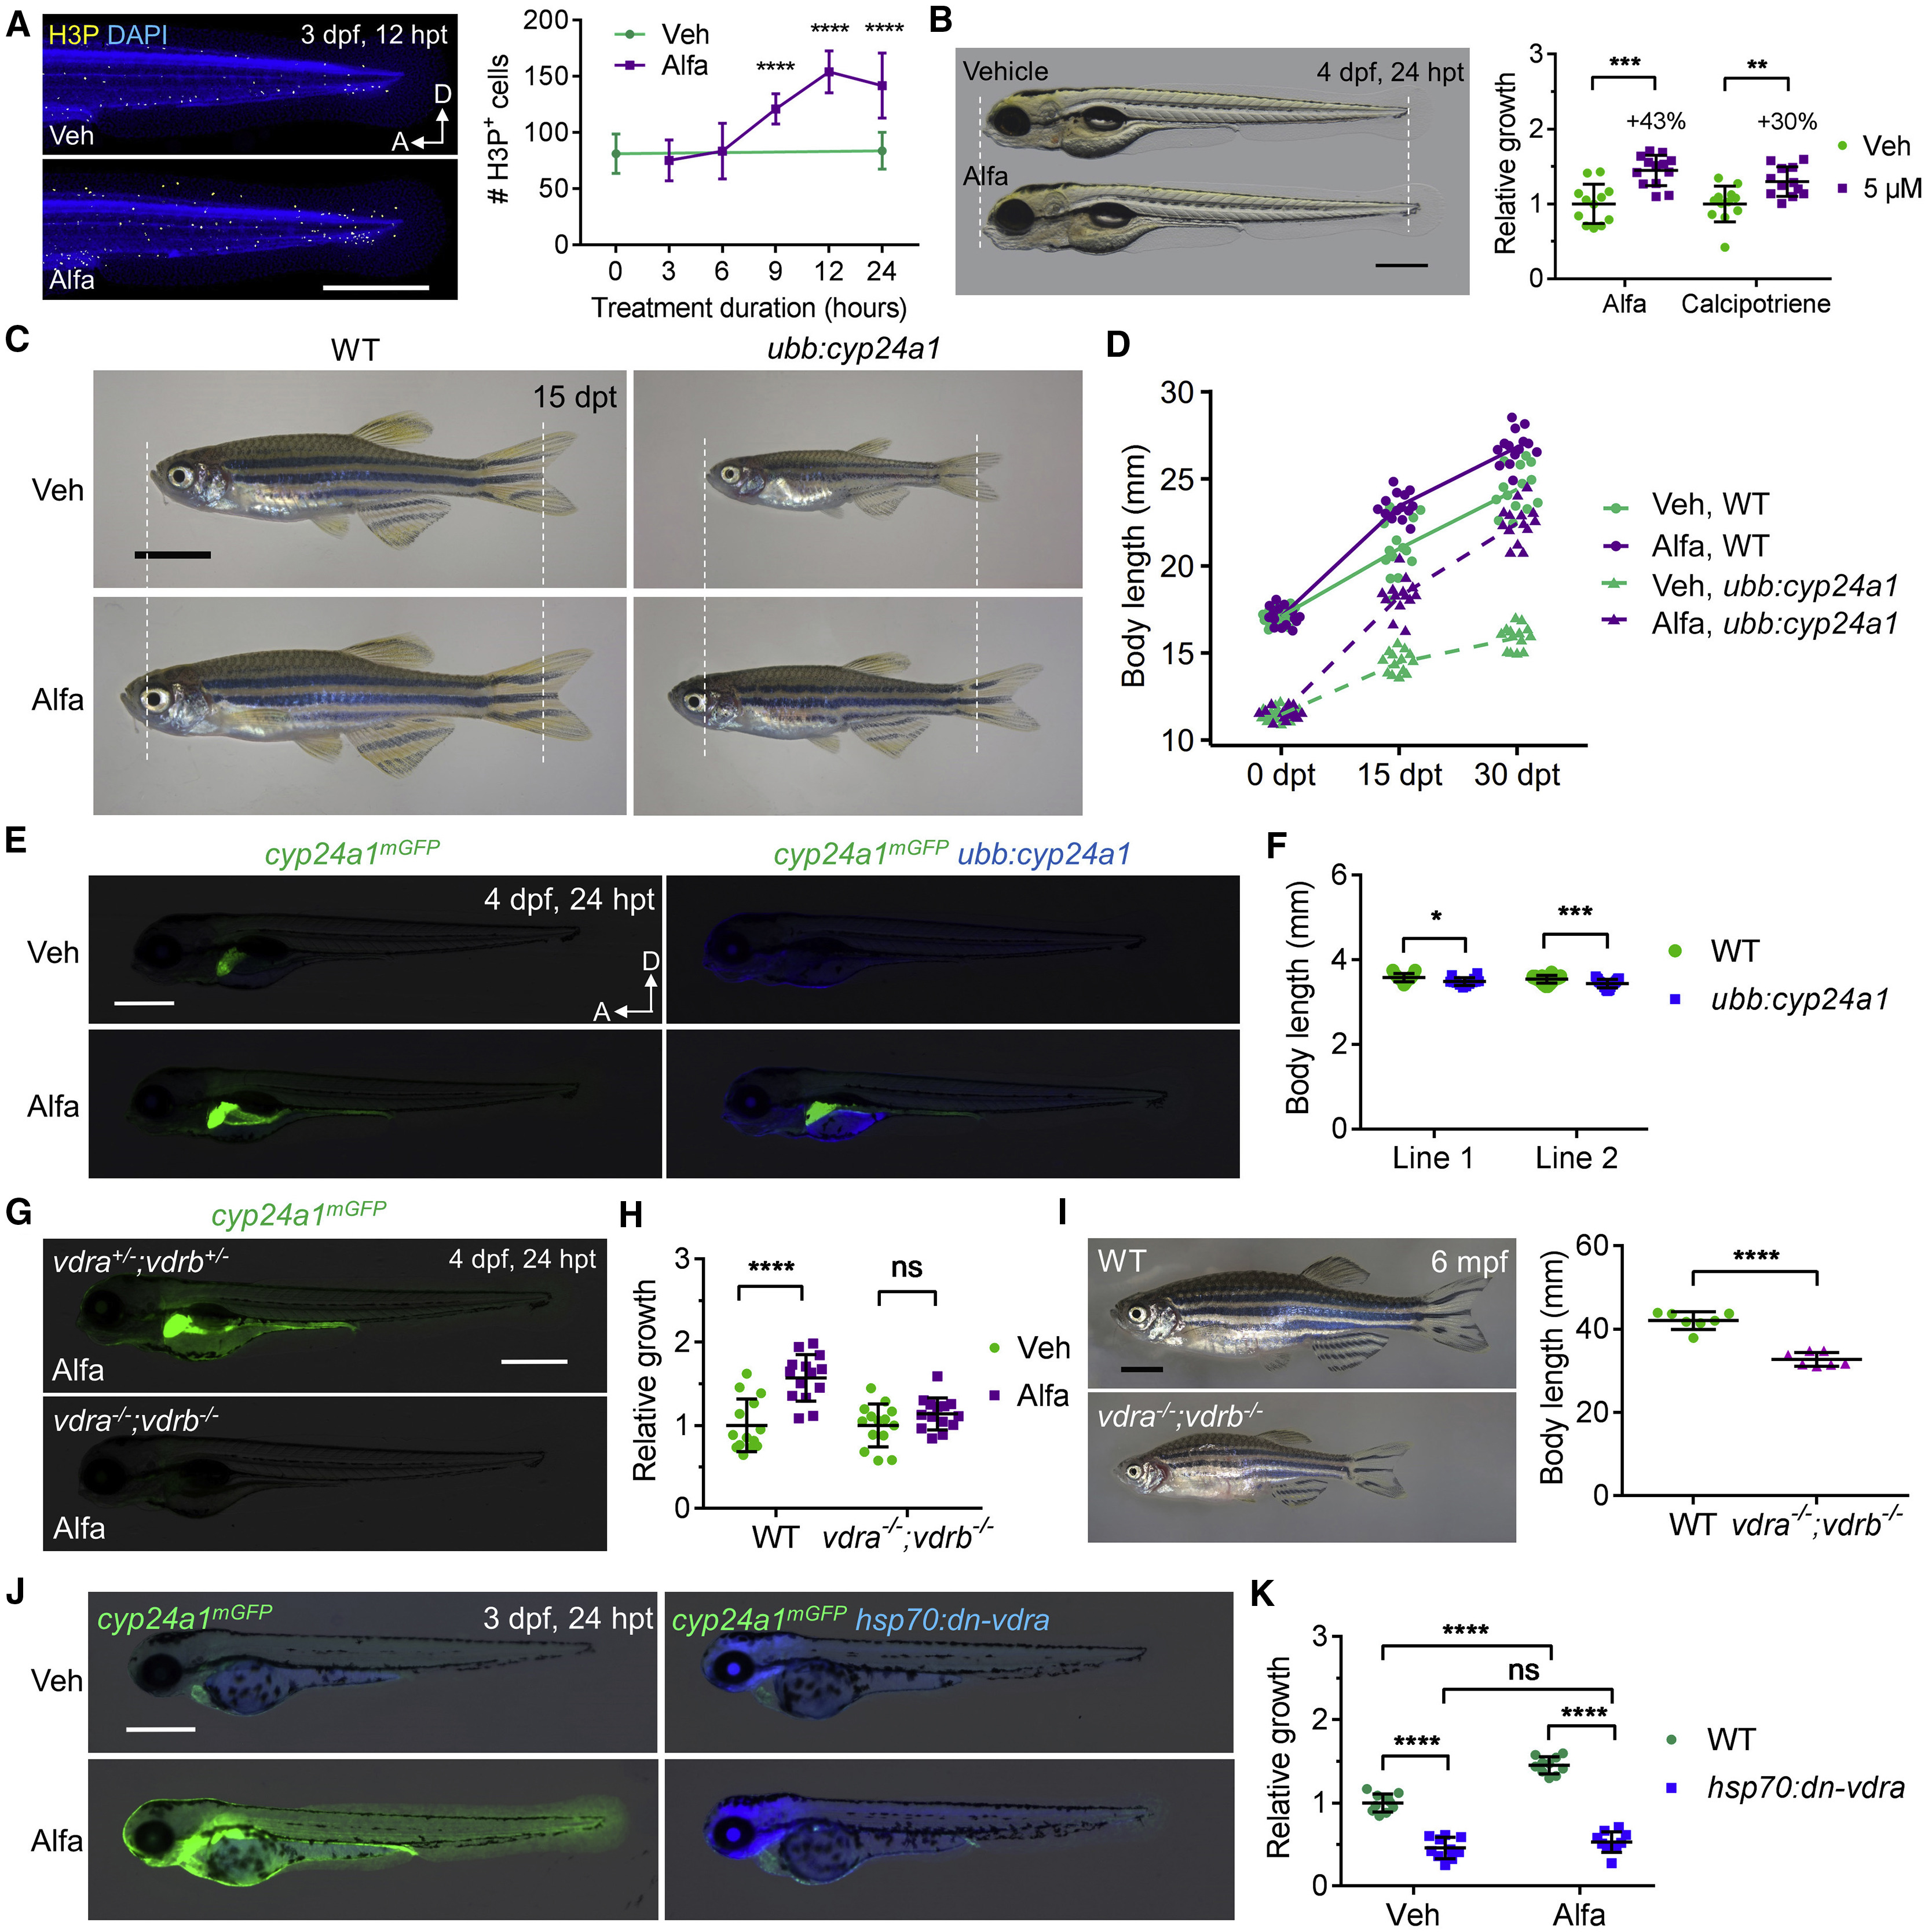
Fig. 2
Vitamin D Signaling Enhances Organismal Size
(A) MIP images and quantification of H3P staining of 3 dpf embryos. hpt, hours post-treatment; H3P, phospho-Histone H3. Mean ± SD, Mann-Whitney test and Student's t test. ∗∗∗∗p < 0.0001. n = 11–13. Scale bar, 500 μm.
(B) Example and quantification of 4 dpf zebrafish growth. Mean ± SD, Mann-Whitney test and Student’s t test. ∗∗p < 0.01; ∗∗∗p < 0.001. n = 12-14. Scale bar, 500 μm.
(C) Growth and rescue of 2 mpf juvenile wild-type (WT) and ubb:cyp24a1 zebrafish. Scale bar, 4 mm.
(D) Quantification of zebrafish length before and after treatment. Mean ± SD. n = 14–15.
(E) mGFP and TagBFP expression in 4 dpf embryos treated with vehicle or 10 nM Alfa. Scale bar, 500 μm.
(F) Quantified body length of two independent ubb:cyp24a1 lines and WT siblings at 4 dpf. Mean ± SD, Mann-Whitney test. ∗p < 0.05. n = 14–23.
(G) cyp24a1mGFP expression in 1 μM Alfa-treated embryos.
(H) Quantification of relative growth of 4 dpf embryos treated with vehicle or Alfa for 24 h. Mean ± SD, Student’s t test. n = 13.
(I) Representative images and body length quantification of 6 mpf zebrafish. mpf, months post-fertilization. Mean ± SD, Student's t test. n = 7. Scale bar, 5 mm.
(J) mGFP and TagBFP expression of 3 dpf embryos after a single heat-shock and 24-h drug treatment. Scale bar, 500 μm.
(K) Quantified relative growth of 4 dpf embryos after a heat shock and 24-h drug treatment. Mean ± SD, Student’s t test. n = 10.
Reprinted from Developmental Cell, 48(6), Han, Y., Chen, A., Umansky, K.B., Oonk, K.A., Choi, W.Y., Dickson, A.L., Ou, J., Cigliola, V., Yifa, O., Cao, J., Tornini, V.A., Cox, B.D., Tzahor, E., Poss, K.D., Vitamin D Stimulates Cardiomyocyte Proliferation and Controls Organ Size and Regeneration in Zebrafish, 853-863.e5, Copyright (2019) with permission from Elsevier. Full text @ Dev. Cell