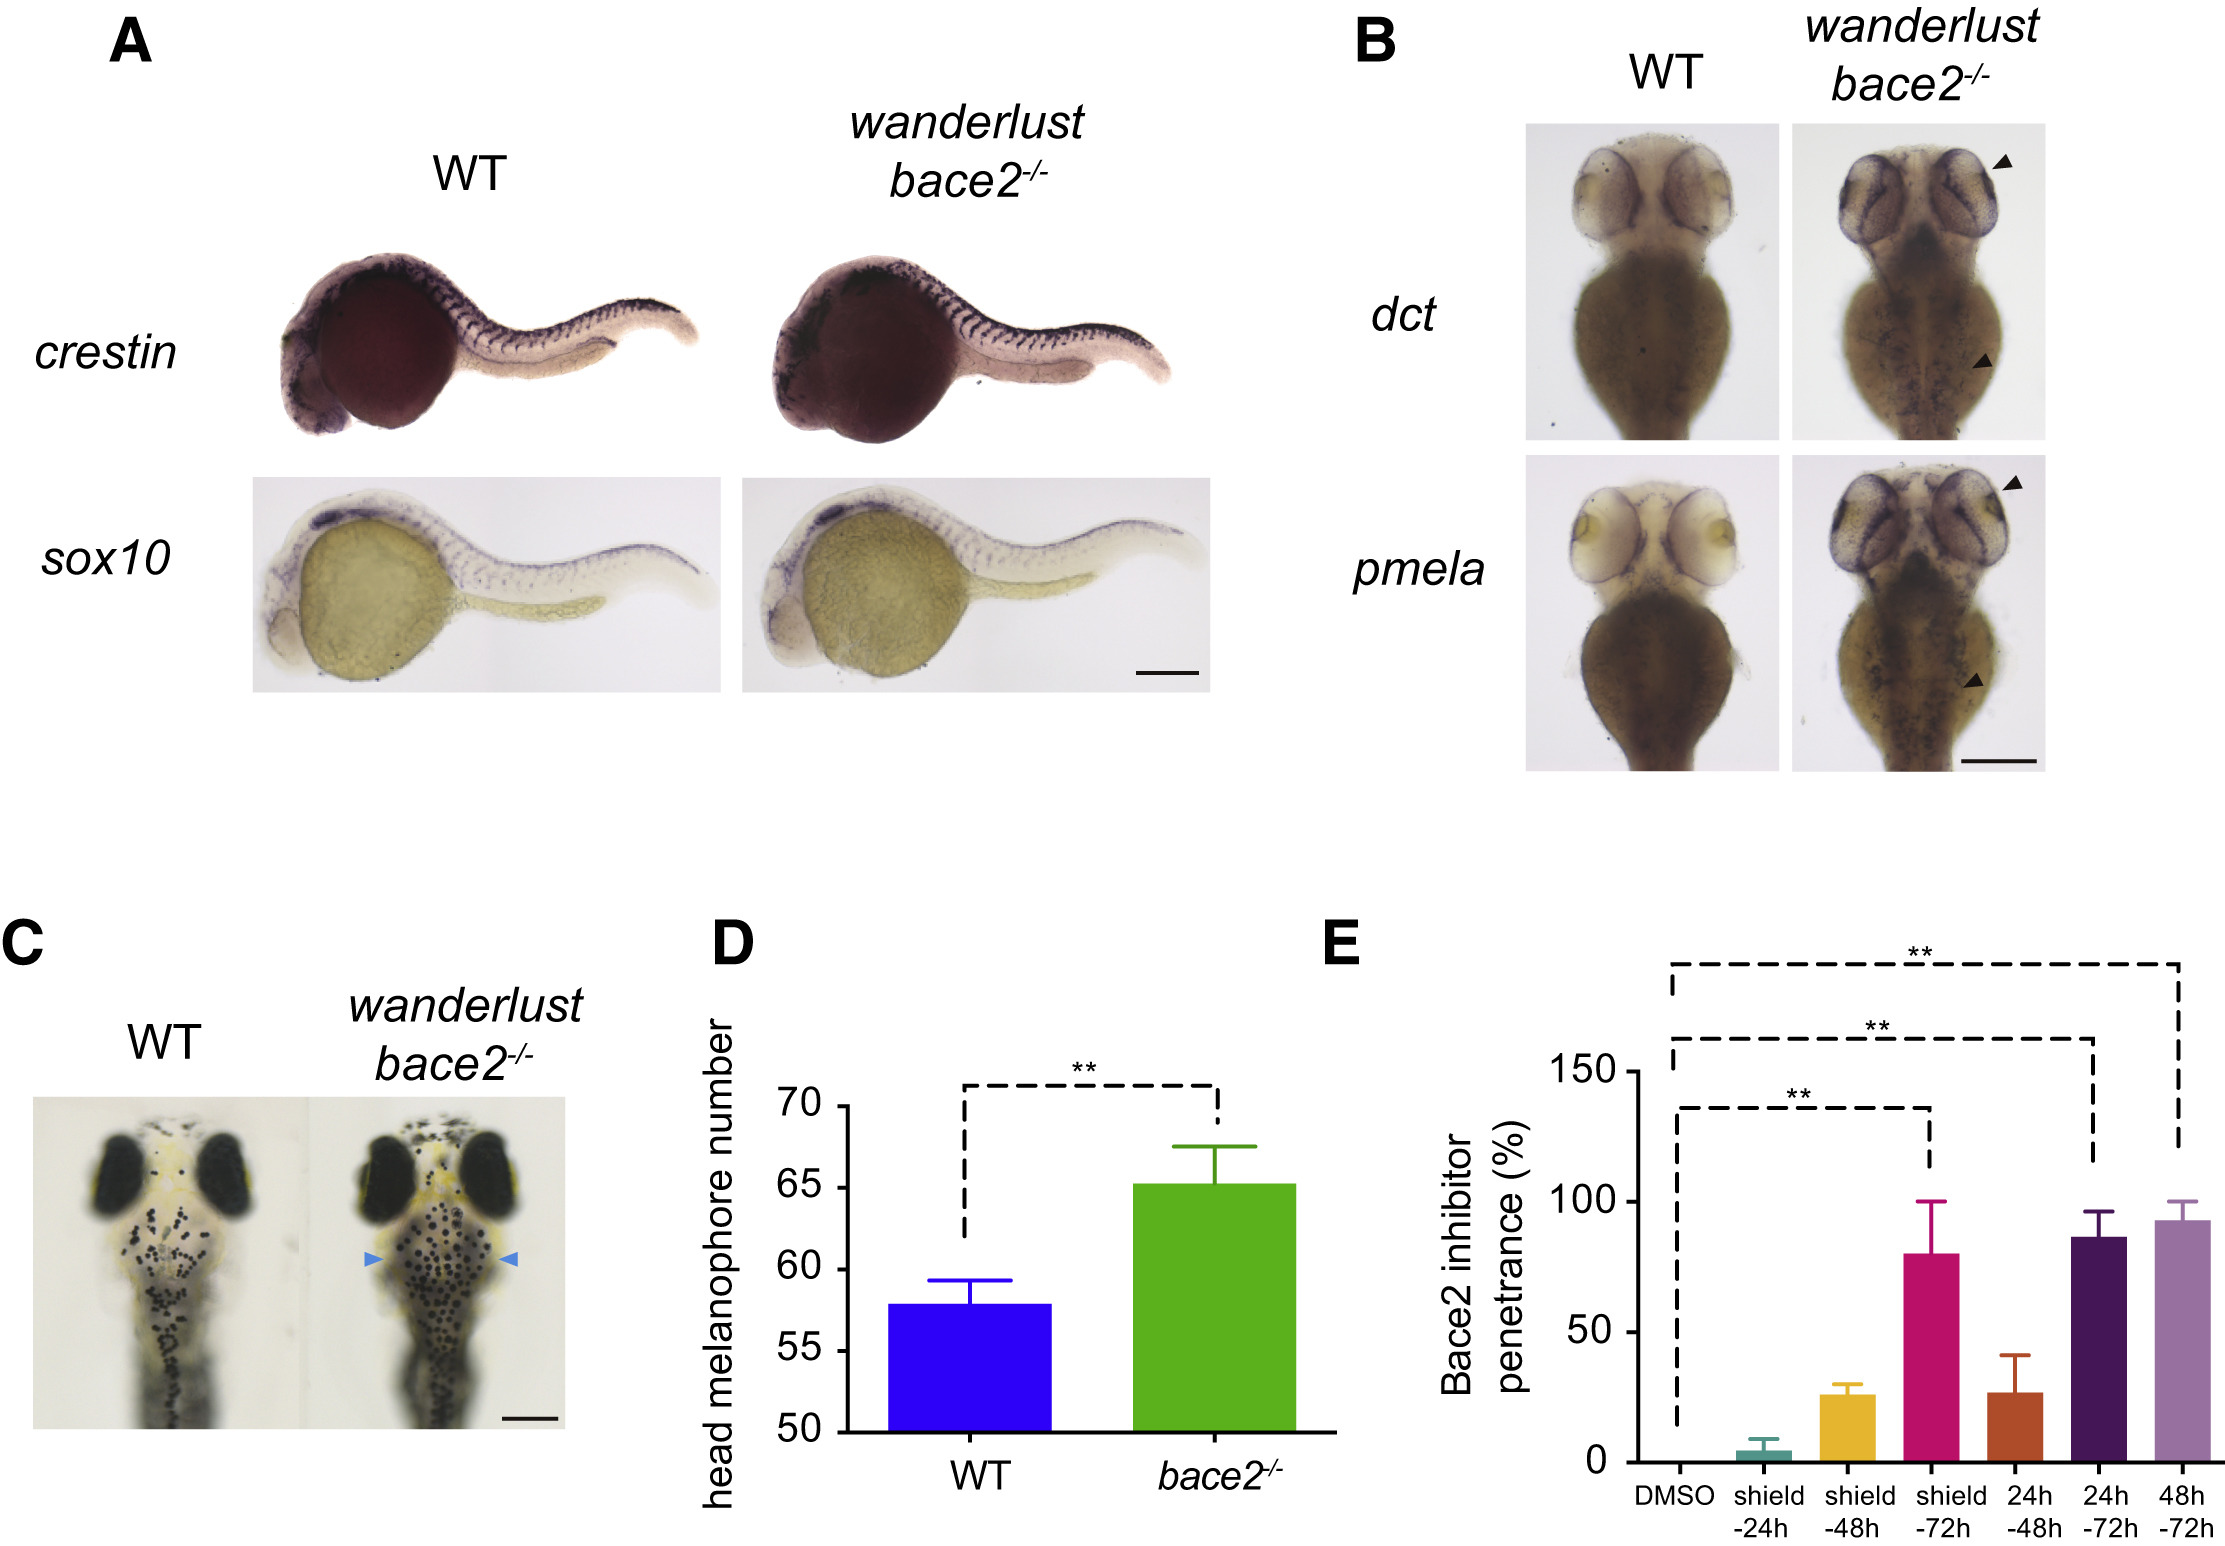
Fig. 2
Bace2 Acts during Melanophore Differentiation
(A) At 24 hpf, ISH shows the bace2?/? mutants have unaffected expression for neural crest markers crestin and sox10.
(B) But at 72 hpf, ISH shows mRNA for the pigmentation genes dct and pmela are elevated in bace2?/? mutants, especially in the head (arrowhead).
(C and D) Consistently, bace2?/? mutants have increased numbers of pigmented melanophores in the head (arrowhead). Fish number n(WT) = 55, n(bace2?/?) = 30, two-tailed t test, ??p < 0.01.
(E) Treatment of WT embryos with 100 ?M Bace2 inhibitor (PF-06663195) from 48 to 72 hpf is sufficient to phenocopy bace2?/?. Data are from two independent experiments, with total fish numbers: n(DMSO) = 21, n(shield-24h) = 45, n(shield-48h) = 56, n(shield-72h) = 72, n(24h-48h) = 58, n(24h-72h) = 40, n(48h-72h) = 49; one-way ANOVA followed by Holm-Sidak's multiple comparisons test, ??p < 0.01. All bar graphs are presented as means ± SEM. Scale bars, 200 ?m.
See also Figures S1 and S2.
Reprinted from Developmental Cell, 45(5), Zhang, Y.M., Zimmer, M.A., Guardia, T., Callahan, S.J., Mondal, C., Di Martino, J., Takagi, T., Fennell, M., Garippa, R., Campbell, N.R., Bravo-Cordero, J.J., White, R.M., Distant Insulin Signaling Regulates Vertebrate Pigmentation through the Sheddase Bace2, 580-594.e7, Copyright (2018) with permission from Elsevier. Full text @ Dev. Cell

