
|
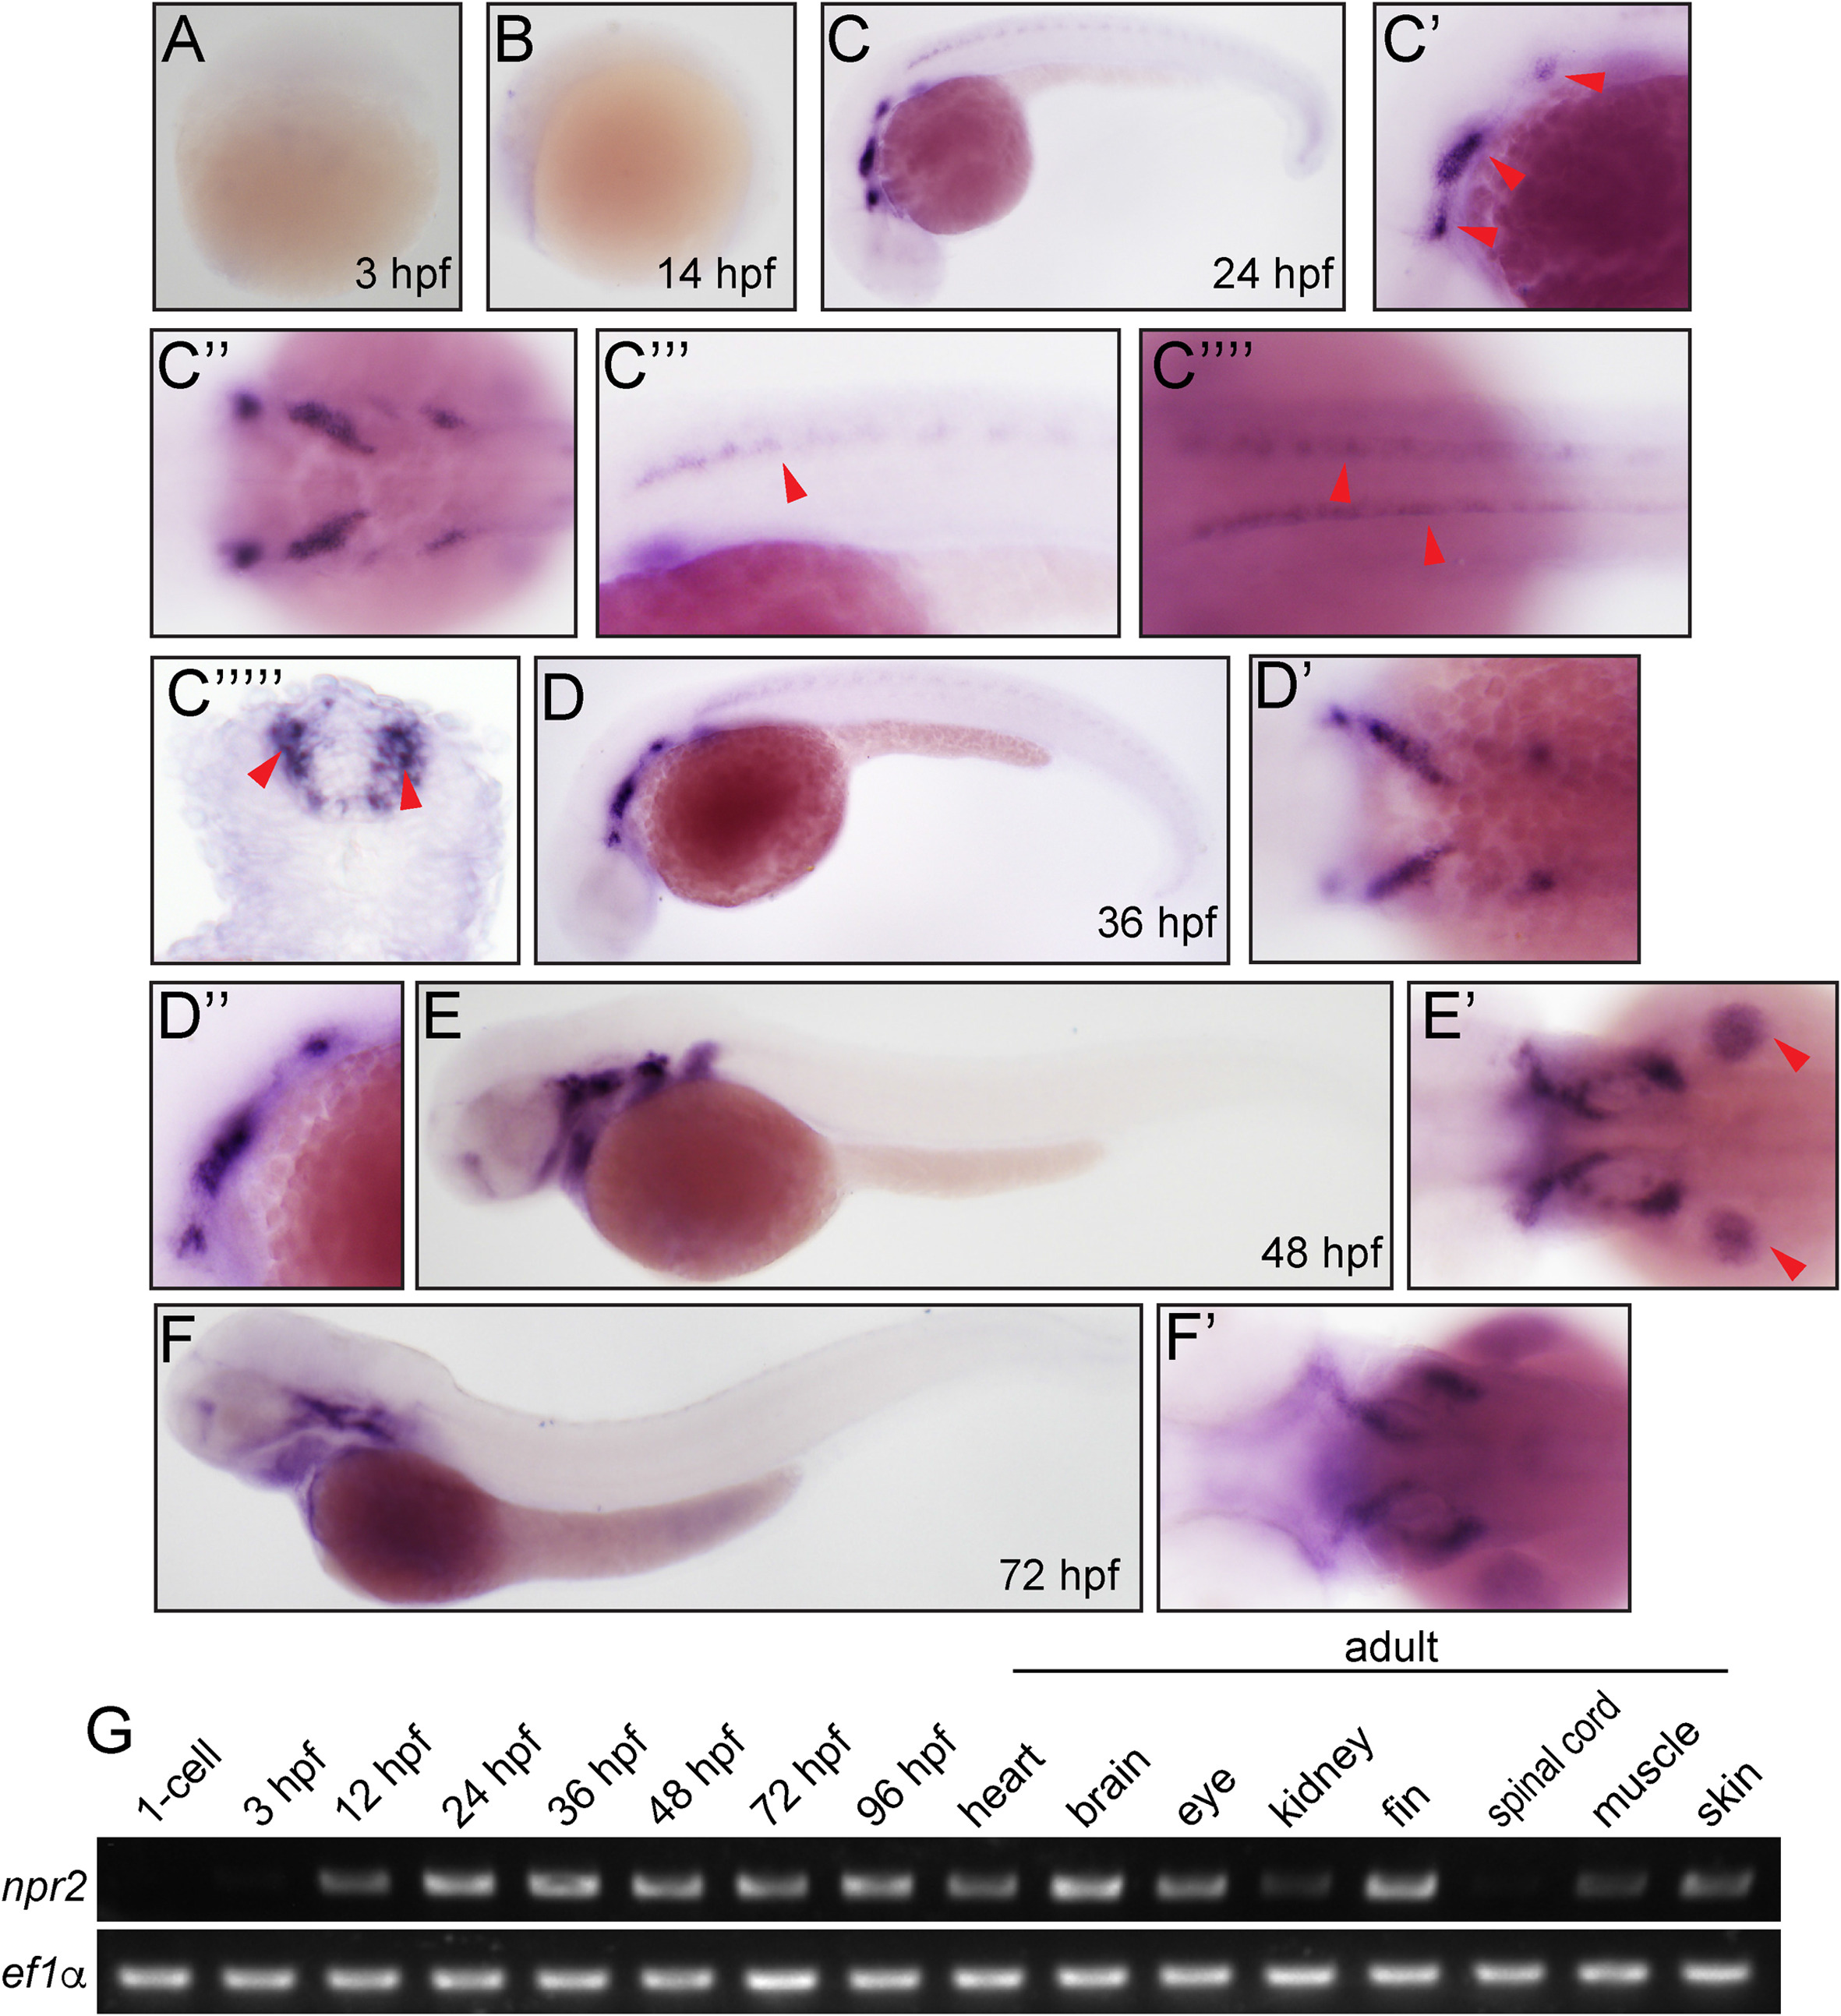
Fig. 4
Expression analysis of zebrafish npr2. (A) 3 hpf, lateral view, no staining. (B) 14 hpf, lateral view, no staining. (C) 24 hpf, lateral view. (C?) 24 hpf, lateral view, arrowhead indicates branchial arches. (C?) 24 hpf, dorsal view. (C?) 24 hpf, lateral view, arrowhead indicates neural tube. (C??) 24 hpf, dorsal view, arrowheads indicate neural tube. (C???) 24 hpf, the trunk transverse section of the embryos, arrowheads indicate neural tube. (D, D?) 36 hpf, lateral view. (D?) 36 hpf, dorsal view. (E) 48 hpf, lateral view, overview of whole body. (E?) 72hpf, lateral view, arrowheads indicate pectoral fins. (F) 72 hpf, lateral view. (F?). 72 hpf, dorsal view. (G) Reverse transcriptase-PCR analysis of zebrafish npr2.
Reprinted from Gene expression patterns : GEP, 29, Gong, J., Chai, L., Xu, G., Ni, Y., Liu, D., The expression of natriuretic peptide receptors in developing zebrafish embryos, 65-71, Copyright (2018) with permission from Elsevier. Full text @ Gene Expr. Patterns