
|
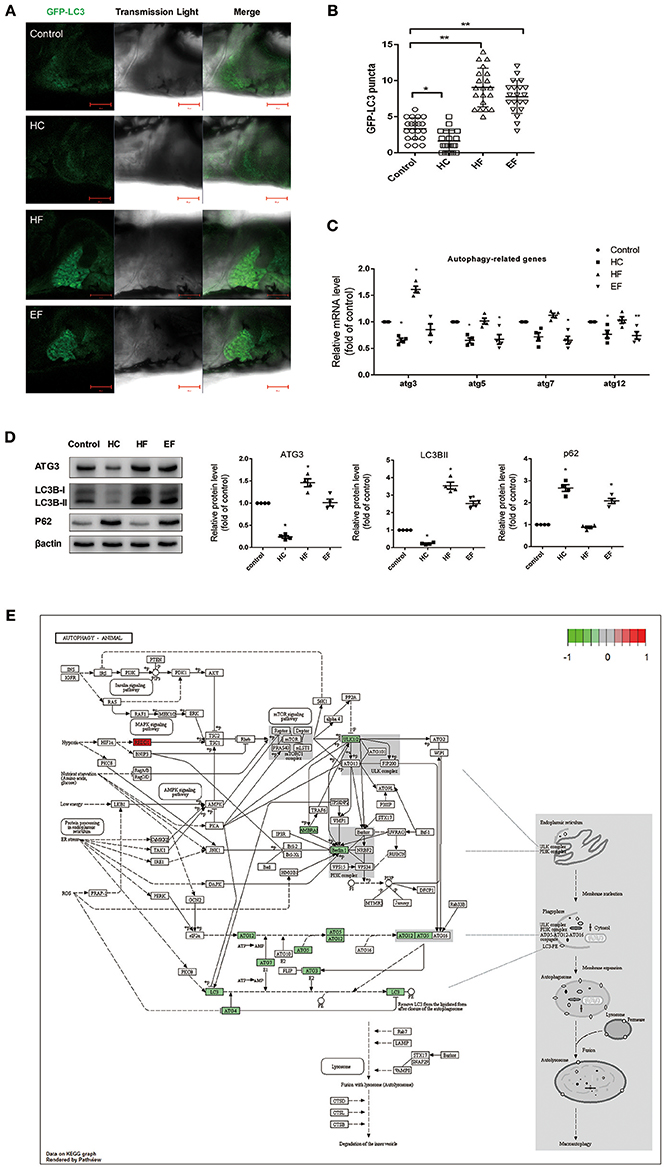
Fig. 4
Effects of HC, HF, and EF diets treatment on autophagy. (A) LC3 puncta formation in liver of GFP-LC3 transgenic zebrafish larvae fed with control, HC, HF, and EF diets. Bar = 100 ?m. (B) Quantification of LC3 puncta abundance in (A) with software Image J. (C) The genes expression involved in autophagy (n = 4). (D) The protein expression of LC3BII, ATG3, and p62 were detected by western blot in liver of zebrafish larvae fed with control, HC, HF, and EF diets (n = 4) *P < 0.05, **P < 0.01 vs. control. (E) Autophagy pathway in HC group by KEGG. Genes with red-filled are up-regulated, while genes with green-filled are down-regulated.