Fig. 2
Fig. 2
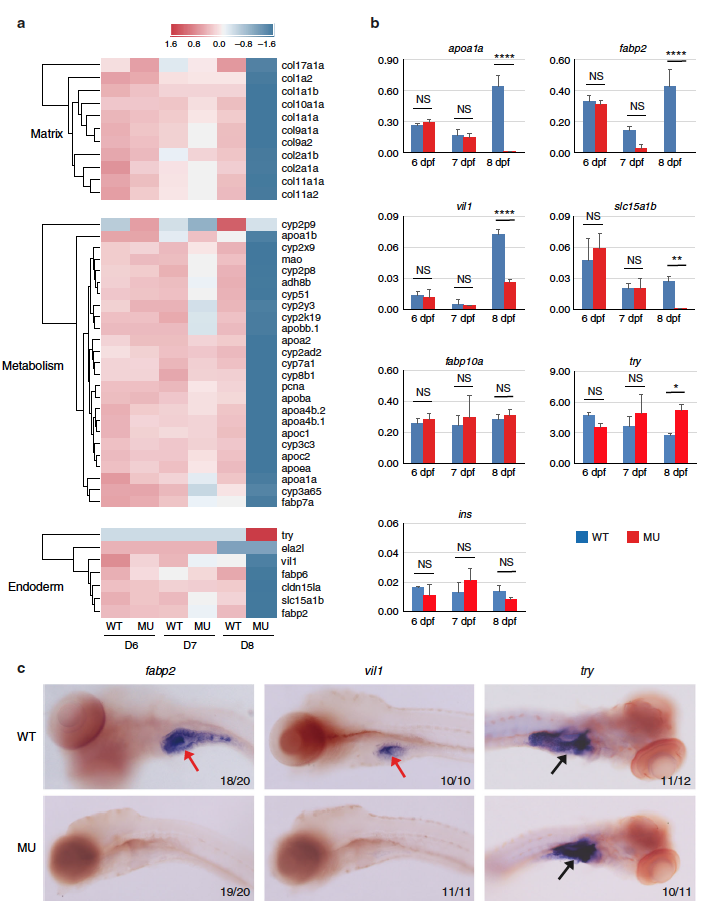
Defective gene expressions in pik3c3 mutants. a RNA-Seq analysis of pik3c3 mutants and control siblings at 6–8 dpf. Representative heatmaps show the expression of genes in one of these categories: extracellular matrix-related genes, liver and gut metabolic genes or markers of endoderm-derived cell lineages. b qRT-PCR analysis of the indicated genes from whole embryonic extracts. apoa1a is an apolipoprotein family member expressed in liver, gut, and other tissues. fabp2 is intestinal fatty acid-binding protein. villin 1 (vil1) and slc15a1b (pept1) are markers of intestinal epithelium. fabp10a is liver fatty acid-binding protein. trypsin (try) and insulin (ins) are markers of exocrine and endocrine pancreas, respectively. gapdh is the internal control and data represent mean ± SD from three independent biological repeats (NS, non-significant; *p < 0.05; **p < 0.01; ****p < 0.0001 in one-way ANOVA with Tukey’s multiple comparison). c In situ hybridization of 8 dpf embryos with the indicated probes. Red arrows point to intestines and black arrows indicate pancreases. Numbers represent (embryos with the indicated phenotype)/(total embryos analyzed)

