
|
Fig. 2
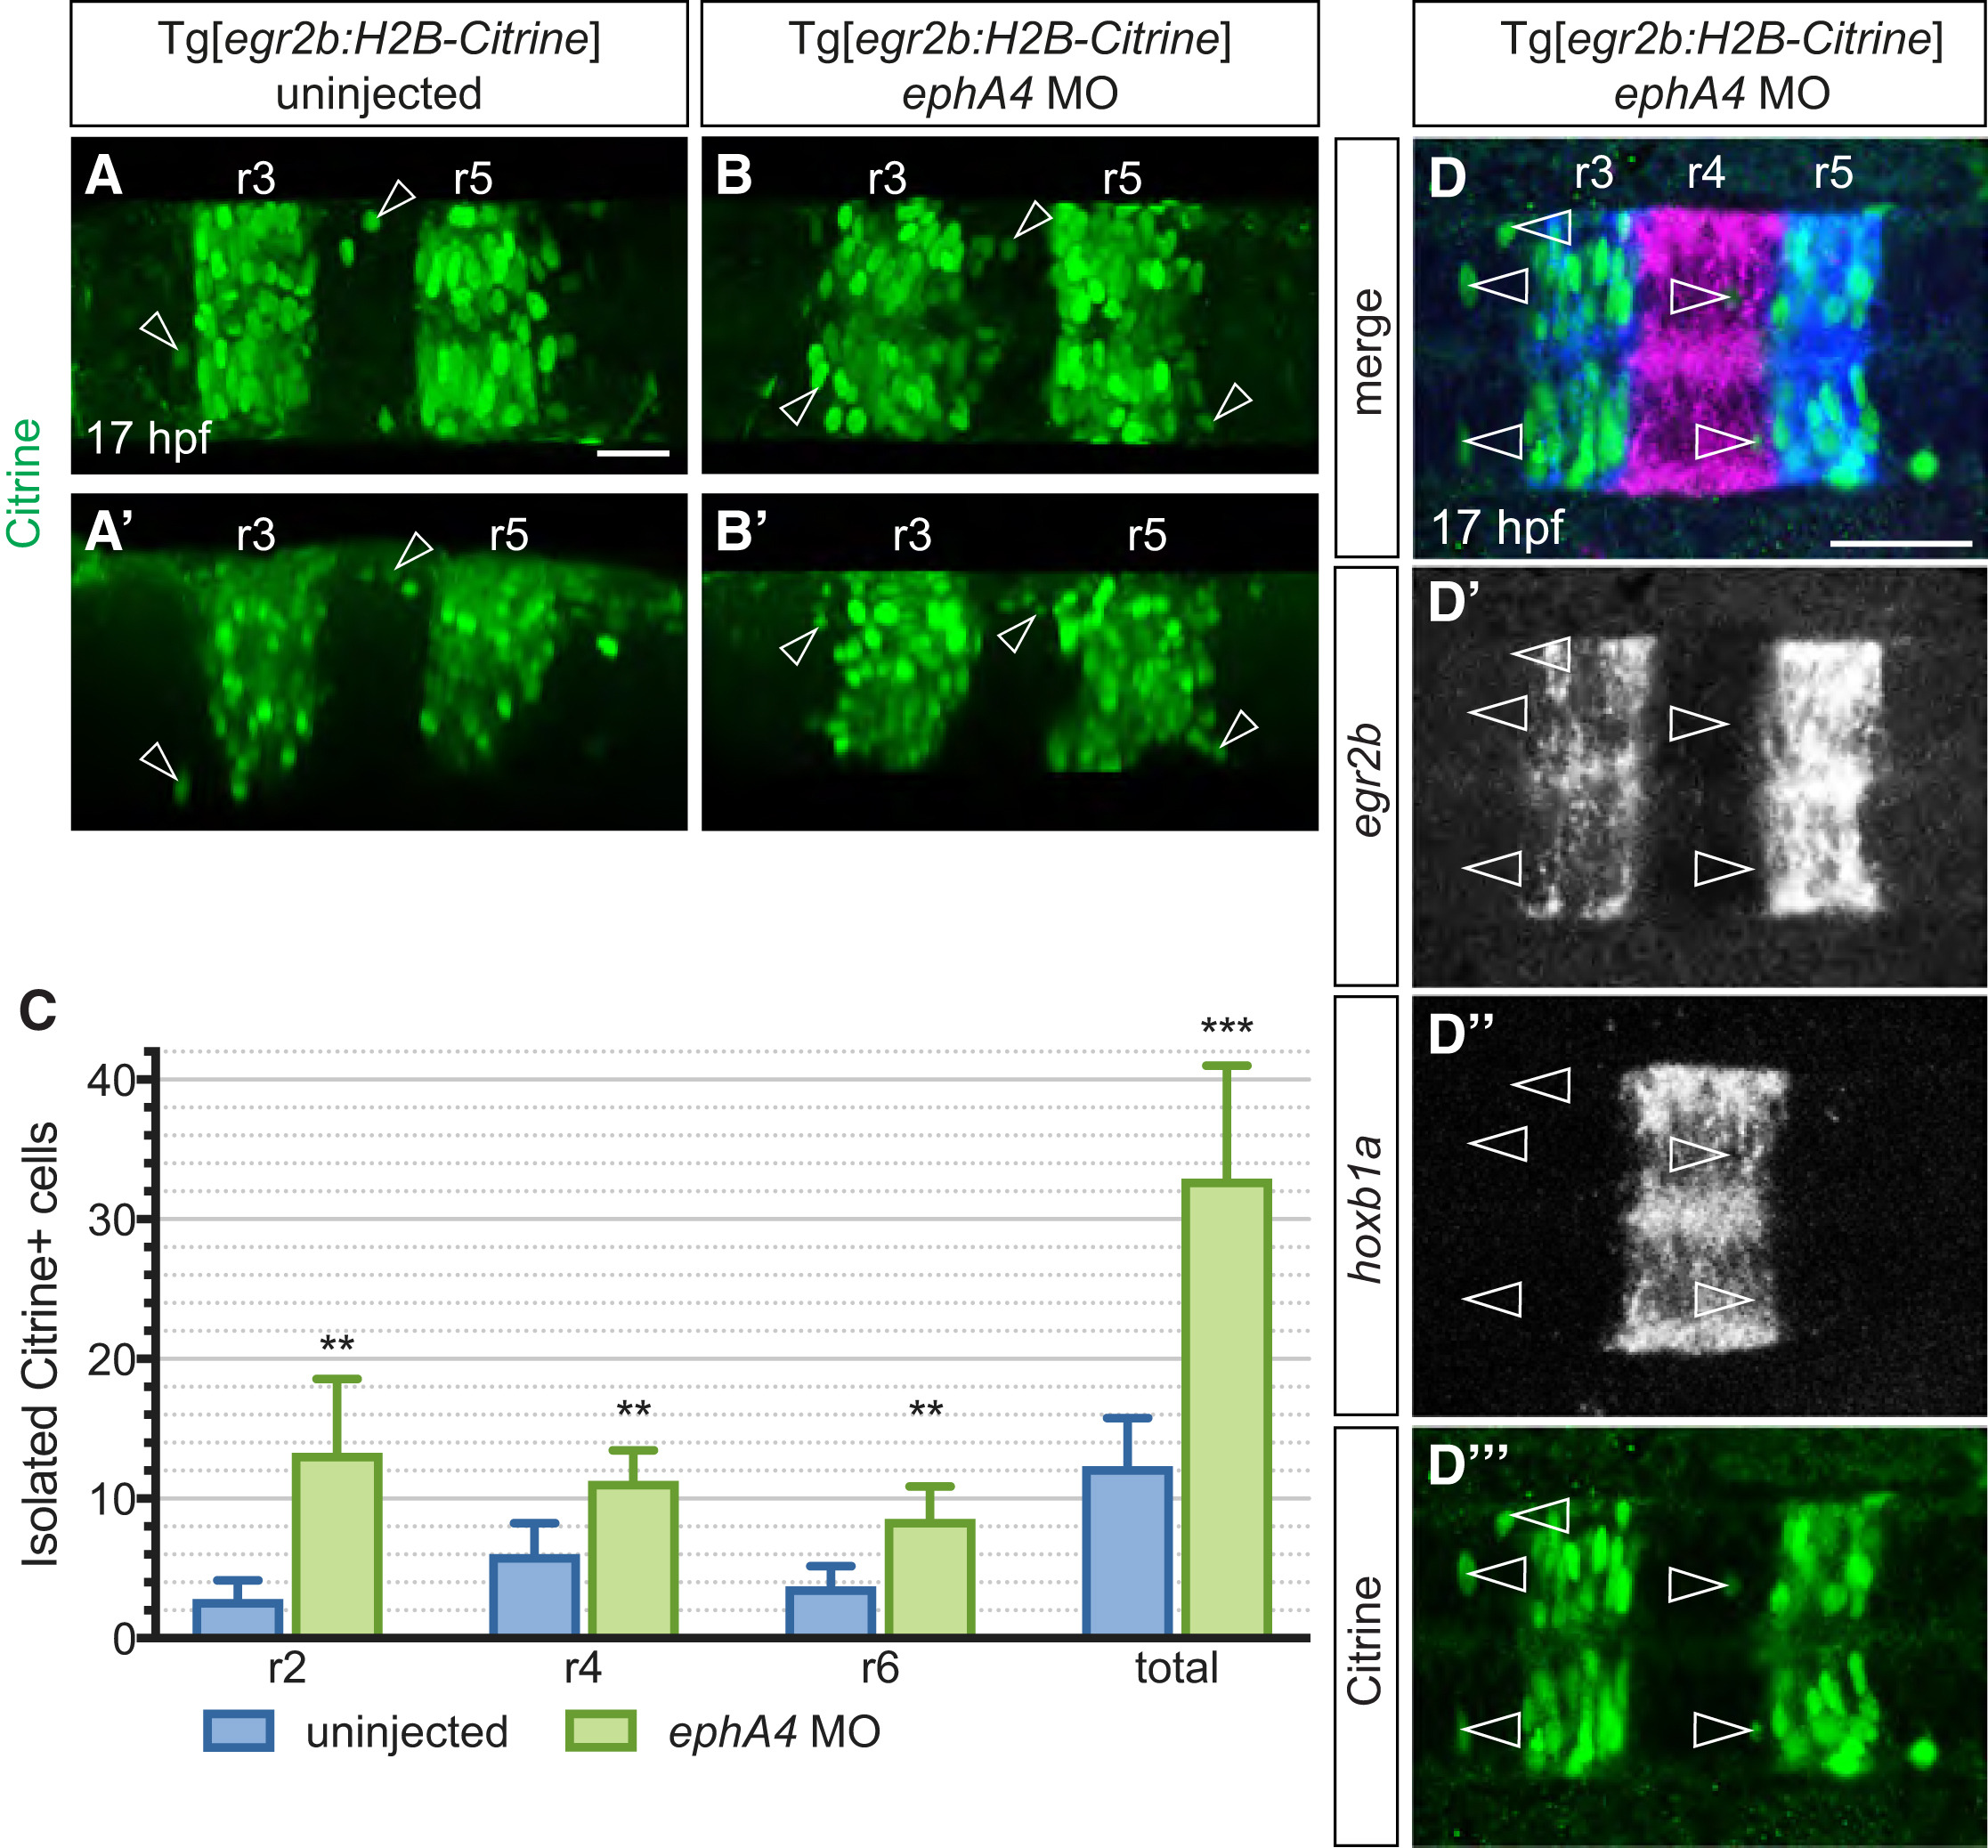
Cell Identity Switching of Ectopic egr2:H2B-Citrine-Expressing Cells
(A and B) Maximum intensity projections of typical uninjected (A) and ephA4 morphant (B) Tg[egr2b:H2B-Citrine] embryos at 17 hpf, with H2B-Citrine protein detected using anti-GFP antibody. Lateral views of the same embryos are shown in (A?) and (B?). Examples of Citrine-positive cells outside r3 and r5 are indicated by arrowheads.
(C) Quantification of isolated ectopic Citrine-positive cells in uninjected and ephA4 morphant embryos. Mean numbers with 95% confidence intervals are shown. Asterisks indicate statistical significance determined by Welsh's t test: r2, p = 0.0014; r4, p = 0.0017; r6, p = 0.0016; total isolated ectopic cells in r2, r4, and r6, p = 0.0002. n = 18 embryos (uninjected), n = 11 embryos (ephA4 morphants).
(D) Double in situ hybridization reveals that isolated Citrine-expressing cells (green in D?, arrowheads in D, D?) in r2, r4, and r6 of ephA4 morphant Tg[egr2b:H2B-Citrine] embryos have downregulated egr2b transcripts (blue in D, grayscale in D?; 105/121 cells). Citrine-expressing cells located in r4 have upregulated hoxb1a (magenta in D, scale in D?). Single slices from a confocal z stack are shown. Scale bars: 50 ?m.
Reprinted from Developmental Cell, 45, Addison, M., Xu, Q., Cayuso, J., Wilkinson, D.G., Cell Identity Switching Regulated by Retinoic Acid Signaling Maintains Homogeneous Segments in the Hindbrain, 606-620.e3, Copyright (2018) with permission from Elsevier. Full text @ Dev. Cell