
Fig. 6
|
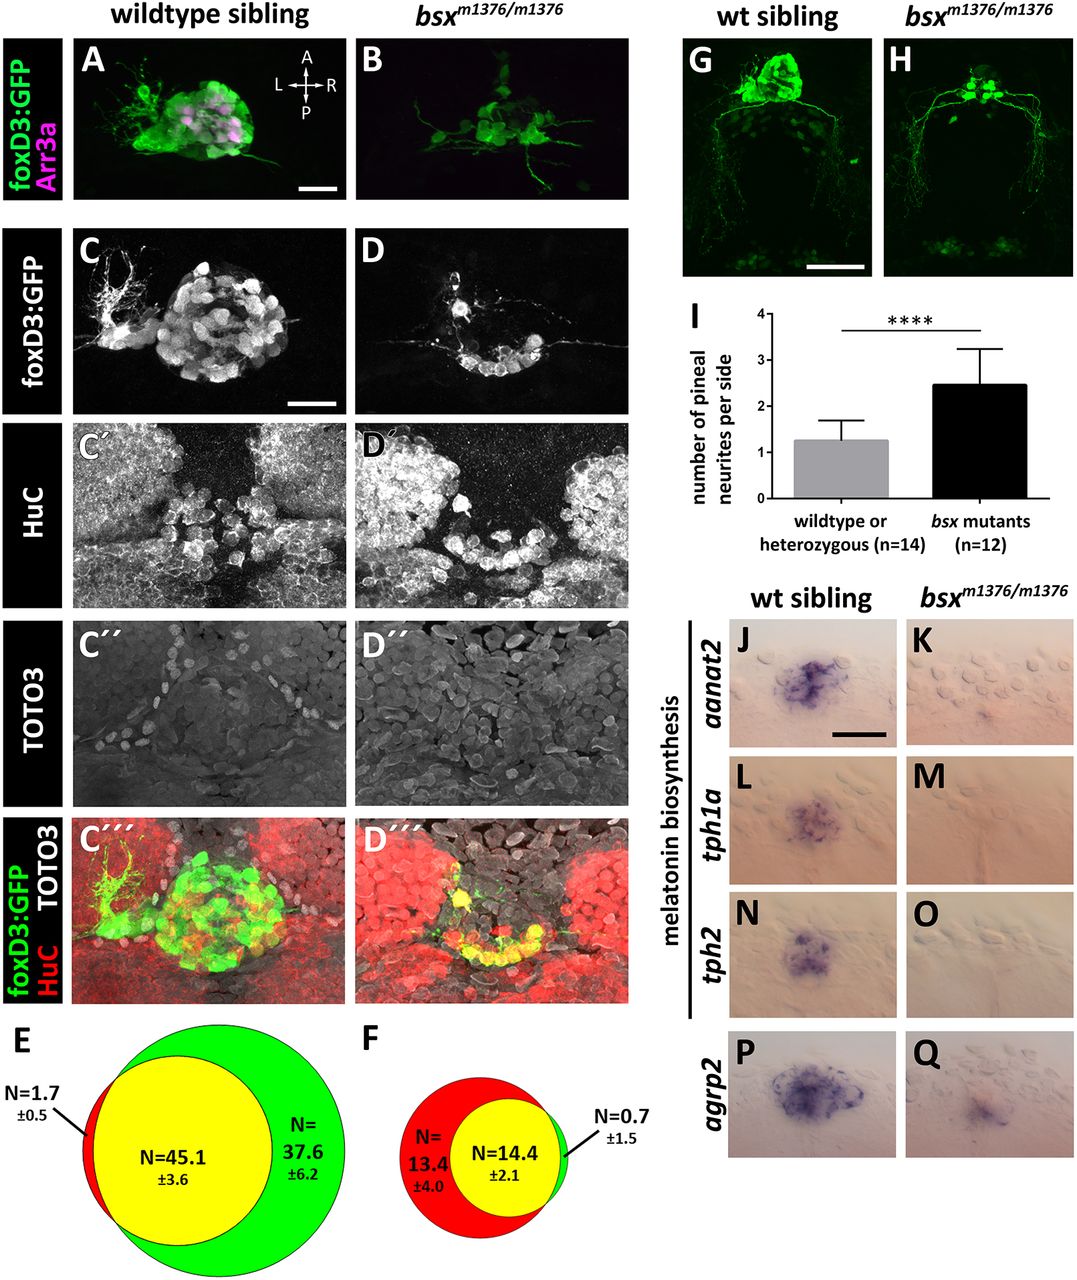
Fig. 6
Abnormal PC cell differentiation in bsx mutant embryos. (A,B) Immunofluorescence for GFP (labeling cone-like PhR cells and PNs) and Arr3a (labeling cone-like PhR cells) using Tg(foxD3:GFP) wild-type or bsx mutant embryos fixed at 78?hpf. Maximum-intensity projections. (C-D?) Combined anti-HuC (labeling PNs) and anti-GFP immunofluorescence and TOTO3 nuclear staining of Tg(foxD3:GFP) wild-type or bsx mutant embryos fixed at 78?hpf. Images are maximum-intensity z-projections of 41?�m confocal stacks encompassing the PC (see Movie 1). (E,F) Average cell numbers�s.d. of GFP+ (green), HuC+ (red) and double-positive (yellow) cells of wild-type (E) and bsx mutant (F) embryos shown in C-D? (n=7 embryos). (G,H) Immunofluorescence for GFP using Tg(foxD3:GFP) wild-type or bsx mutant embryos fixed at 78?hpf. Maximum-intensity projections of confocal image stacks of PG cells and neurites originating from the PG are shown. (I) GFP+ neurites of PNs in Tg(foxD3:GFP) bsx mutant or control embryos were counted. Graph shows average number of neurites per side (left or right hemisphere). Error bars indicate s.d. ****P?0.0001 as revealed by Wilcoxon?Mann?Whitney test. (J-Q) WISH expression analysis of genes encoding enzymes involved in melatonin biosynthesis (J-O) or Agrp2 neuropeptide (P,Q) in wild-type and bsx mutant embryos at 84?hpf (J,K) or 72?hpf (L-Q). Anterior is at the top of the images. All embryos were genotyped. (A,B,J-Q) n?4 embryos each for wild type and mutants. Scale bars: 20?�m (A-D?) and 50?�m (G,H,J-Q).