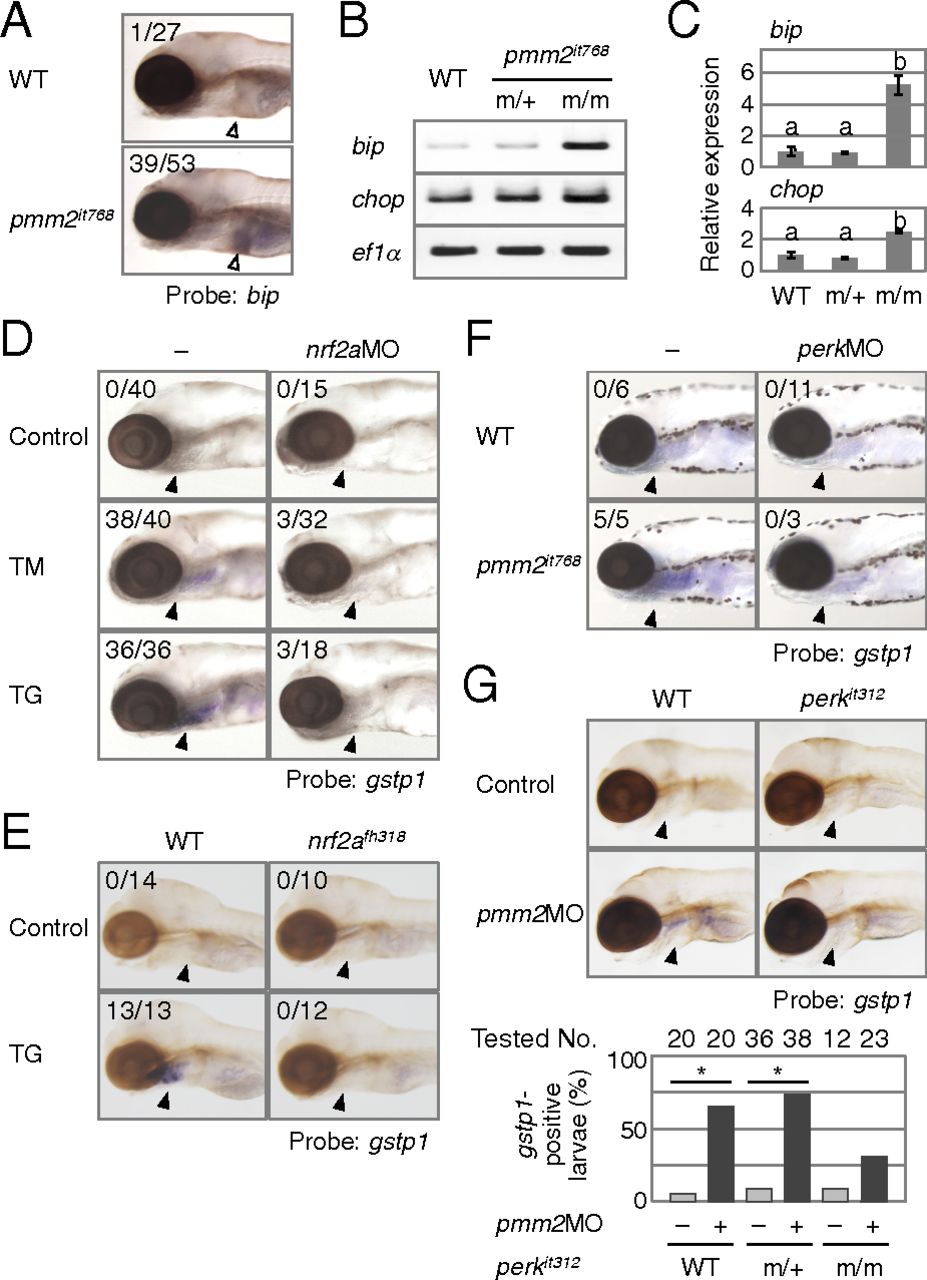
Fig. 3
PERK-dependent activation of Nrf2 in 5-dpf larvae by genetic- and chemical-induced ER stress. The numbers in each picture indicate the larvae exhibiting strong bip expression in the liver (open arrowheads)/tested larvae (A) or strong gstp1 expression in the gills (closed arrowheads)/tested larvae (D?G). (A) bip expression in WT sibling and pmm2it768 larvae. (B) The expression of bip and chop was analyzed by RT-PCR in WT, pmm2it768/+ (m/+), or pmm2it768/it768 (m/m) larvae. The amount of cDNA used for RT-PCR was standardized by the ef1? expression. (C) The relative expression levels of bip and chop to ef1? was evaluated by qPCR in WT, pmm2it768/+ (m/+), or pmm2it768/it768 (m/m) larvae. a and b indicate statistically significant differences (Tukey?s test, P < 0.001; n = 3 for each genotype). (D) Induced expression of gstp1 after 12-h treatment of 5 ?g/mL tunicamycin (TM) or 2 ?M thapsigargin (TG) in WT AB larvae injected or not with 1 pmol nrf2aMO. (E) Induced expression of gstp1 after 12-h treatment of 1 ?M thapsigargin (TG) in WT sibling and nrf2afh318 larvae. (F) gstp1 expression in WT sibling and pmm2it768 larvae injected or not with 1 pmol perkMO. (G) gstp1 expression in WT sibling and perkit312 larvae injected or not with 1 pmol pmm2MO. The graph shows the percentages of gstp1-positive larvae of the indicated genotypes. The numbers of larvae tested are indicated above the bars. Asterisks denote statistical significance (Fisher?s exact test; *P < 0.001). The data were obtained based on the results of the WISH analysis shown in the Upper panels.

