
|
Fig. 4
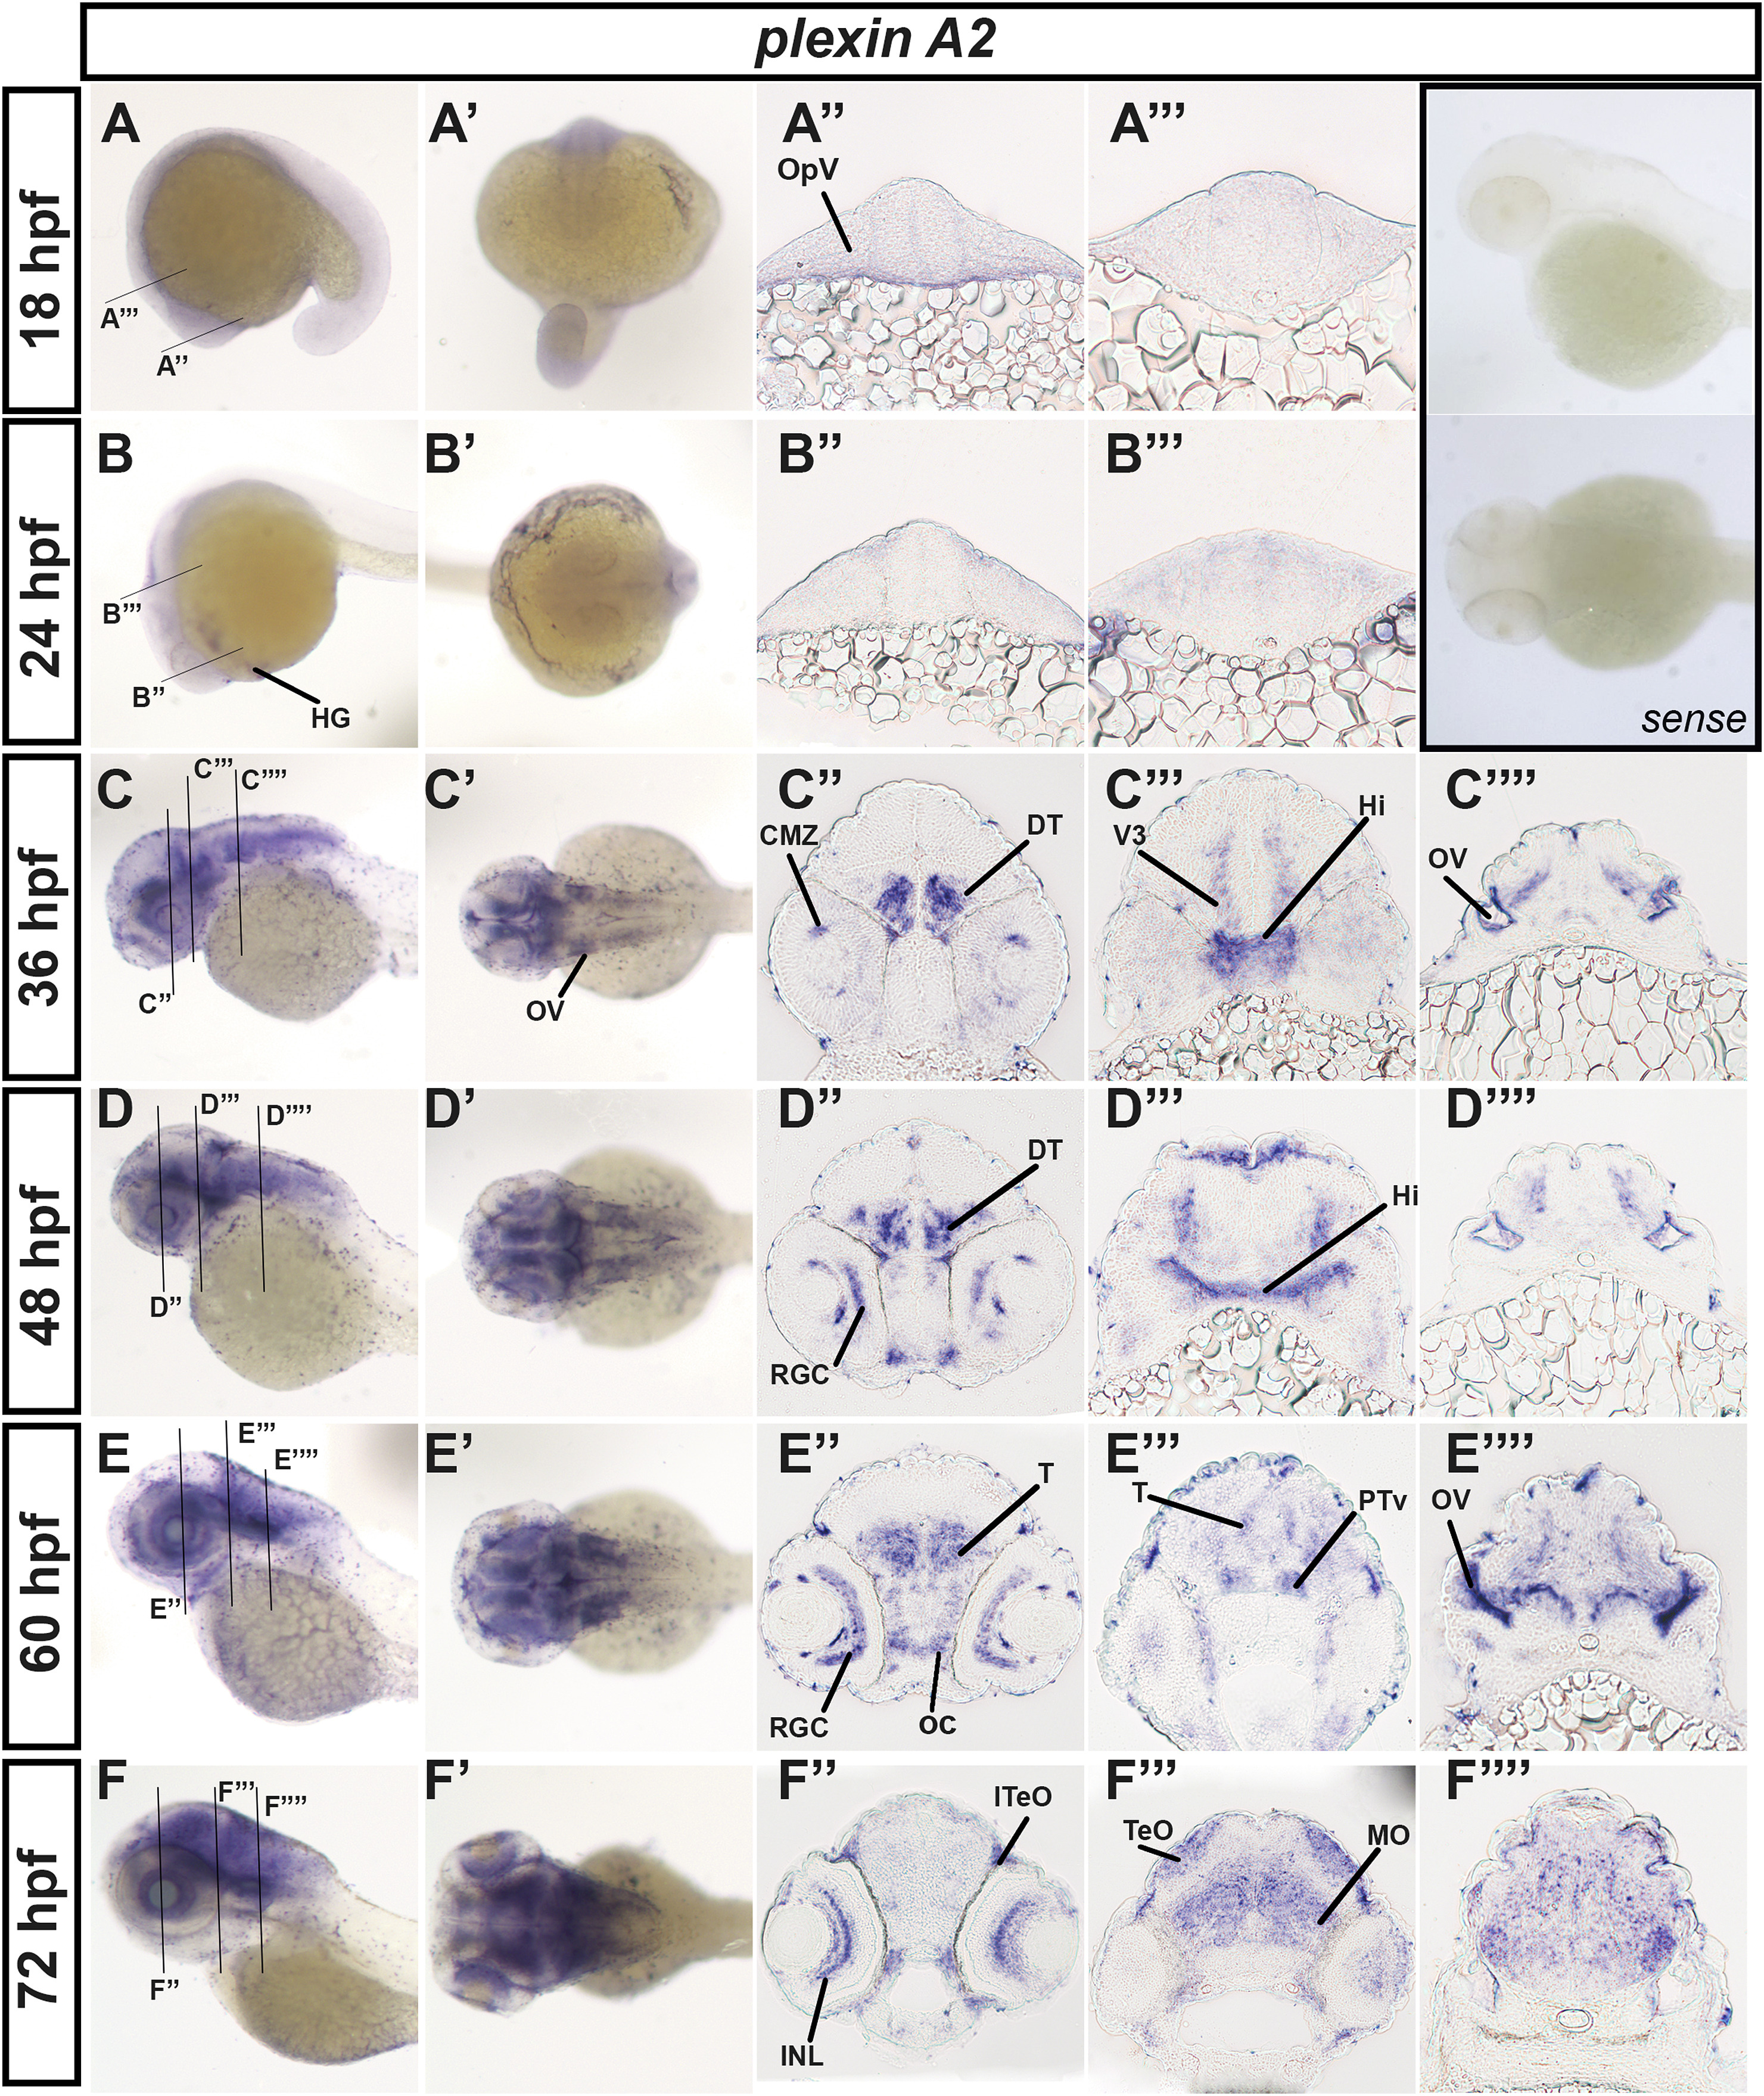
plxnA2 expression in the developing zebrafish.
Brightfield images of zebrafish embryos processed for in situ hybridization. (A-F) Whole-mount lateral, (A?-F?) whole-mount dorsal. Brightfield sections (A??-F??) forebrain, (A???-F???) midbrain and (C????-F????) hindbrain. Embryos were imaged at different developmental time points. (A-A???) 18 hpf, (B-B???) 24 hpf, (C-C????) 36 hpf, (D-D????) 48 hpf, (E-E????) 60 hpf, and (F-F????) 72 hpf. Lines in (A-F) indicate locations of the sections shown at that time-point. Inset shows sense probe control. Hpf-hours post fertilization, OpV- optic vesicle, HG-hatching gland, CMZ-cilliary marginal zone, DT-dorsal thalamus, V3- 3rd ventricle, Hi-intermediate hypothalamus, OV- otic vesicle, oc-optic chiasm, RGC- retinal ganglion cell layer, INL-inner nuclear layer, T-thalamus, PTv-ventral part of posterior tuberculum, lTeO- lateral optic tectum, MO- medulla oblongata.
Reprinted from Gene expression patterns : GEP, 27, Emerson, S.E., Light, S.E., Ebert, A.M., Neuronal expression patterns of the PlexinA family during zebrafish development, 56-66, Copyright (2017) with permission from Elsevier. Full text @ Gene Expr. Patterns