Fig. 3
Fig. 3
Cell Fate of Dnd-Depleted PGCs Following Cell Division and in Late Embryogenesis
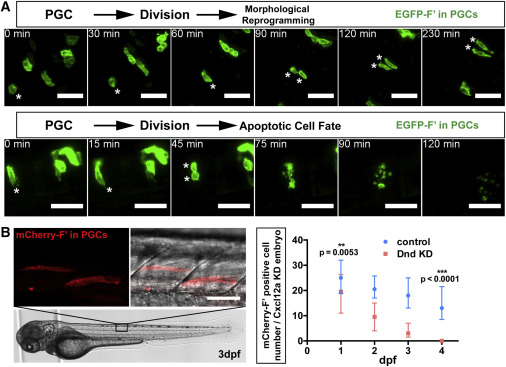
(A) Following division of Dnd-deficient PGCs (asterisks), both daughter cells undergo morphological reprogramming in the neural plate (upper panels, cells were imaged at 11?15 hpf) or die (lower panels, cells were imaged at 15?17 hpf). Scale bars, 50 ?m.
(B) PGCs (red, left) deficient for Dnd localized to the developing muscle tissue of a 3 days dpf embryo. The graph on the right shows the number of PGCs detected in control embryos and in embryos knocked down for Dnd between 1 and 4 dpf. PGCs were labeled with mCherry-F?. Scale bar, 50 ?m. Directional migration was inhibited by knockdown of Cxcl12a, rendering the control cells ectopic. 21 ? n ? 38, (n, number of embryos). p Values were determined using the Mann-Whitney U test with ? = 0.05. Data are presented as median ± IQR.
F?, farnesylated; KD, knockdown; dpf, days post fertilization; hpf, hours post fertilization. See also Figure S3; Movies S3 and S4.
Reprinted from Developmental Cell, 43, Gross-Thebing, T., Yigit, S., Pfeiffer, J., Reichman-Fried, M., Bandemer, J., Ruckert, C., Rathmer, C., Goudarzi, M., Stehling, M., Tarbashevich, K., Seggewiss, J., Raz, E., The Vertebrate Protein Dead End Maintains Primordial Germ Cell Fate by Inhibiting Somatic Differentiation, 704-715.e5, Copyright (2017) with permission from Elsevier. Full text @ Dev. Cell

