Fig. 6
Fig. 6
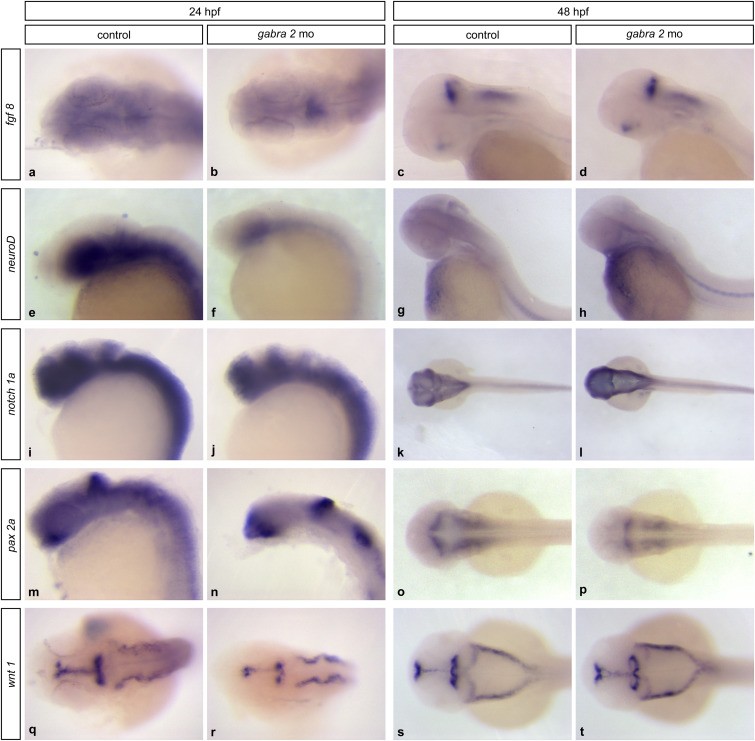
Effect of the knocking down of gabra2 gene on the expression pattern of several developmental markers. ISH studies were conducted on control embryos (a, c, e, g, i, k, m, o, q and s) and on gabra2 morphants (b, d, f, h, j, l, n, p, r and t) at 24 hpf (a, b, e, f, i, j, m, n, q and r) and 48 hpf (c, d, g, h, k, l, o, p, s and t) to establish the expression pattern of several markers known to be involved in CNS development: (a–d) fgf8; (e–h) neuroD; (i–l) notch1a; (m–p) pax2a; and (q–t) wnt1. Note that the expression patterns of all genes are altered in gabra2 deficient fish, and that the mid- and hindbrain regions are more affected than the forebrain. Embryos are oriented with the anterior towards the left and posterior towards the right. (a, b, k, l and o–t) dorsal views; (c–j, m and n) lateral views.

