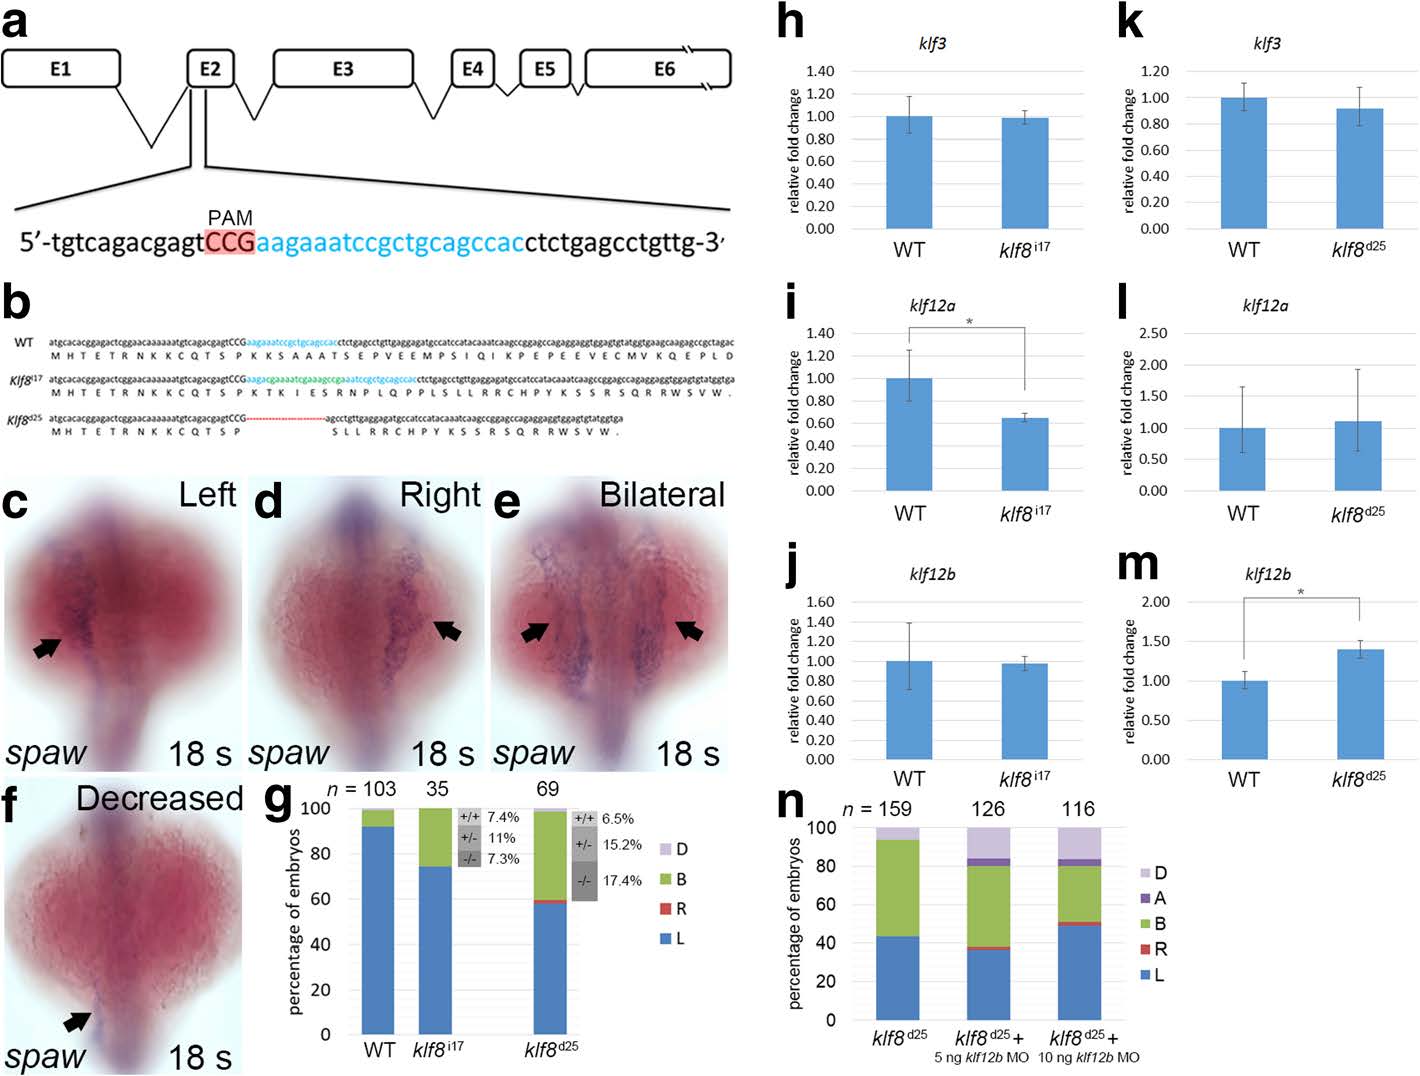
Fig. 6
Generation of klf8 mutants by CRISPR-Cas9 gene editing and the effect on spaw expression. a klf8 genomic structure with klf8 sgRNA (blue lettering) targeted to exon 2. Protospacer adjacent motif (PAM) sequence is shown in red. b Nucleotide and predicted amino acid sequences of klf8 in wild type, klf8 I17 and klf8d25 mutants are shown. Deleted nucleotides are shown by a red dashed line, while inserted nucleotides are shown in green lettering. Representative images of embryos with different spaw expression patterns in the LPM at 18 s stage (arrow; c-f). g Percentage of embryos displayed left (L), right (R), decreased (D) or bilateral (B) expression of spaw in the LPM from intercross of respective klf8 d25 or klf8 i17 F2 heterozygous mutants. Deduced percentage of wild type (+/+), heterozygote (+/?) or homozygote (?/?) genotype of embryos from intercross of respective klf8 d25 or klf8 i17 F2 heterozygous mutants exhibited bilateral spaw expression pattern. Expression levels of klf3 (h, k), klf12a (i, l) or klf12b (j, m) were compared between wild type and respective klf8 d25 and klf8 i17 F5 homozygous mutant embryos at 10?12 s stages (h-m). Knockdown of klf12b reduced the percentage of embryos with bilateral spaw expression in the LPM of klf8 d25 F6 homozygous mutant embryos, but the reduction did not reach significance (p = 0.45 for the comparison between klf8 d25 and klf8 d25 + 5 ng klf812b MO, p = 0.05 for the comparison between klf8 d25 and klf8 d25 + 10 ng klf812b MO) (n). Statistical significance was determined by Student?s t-test. * p < 0.05. Error bars indicate standard deviation

