Fig. 1
Fig. 1
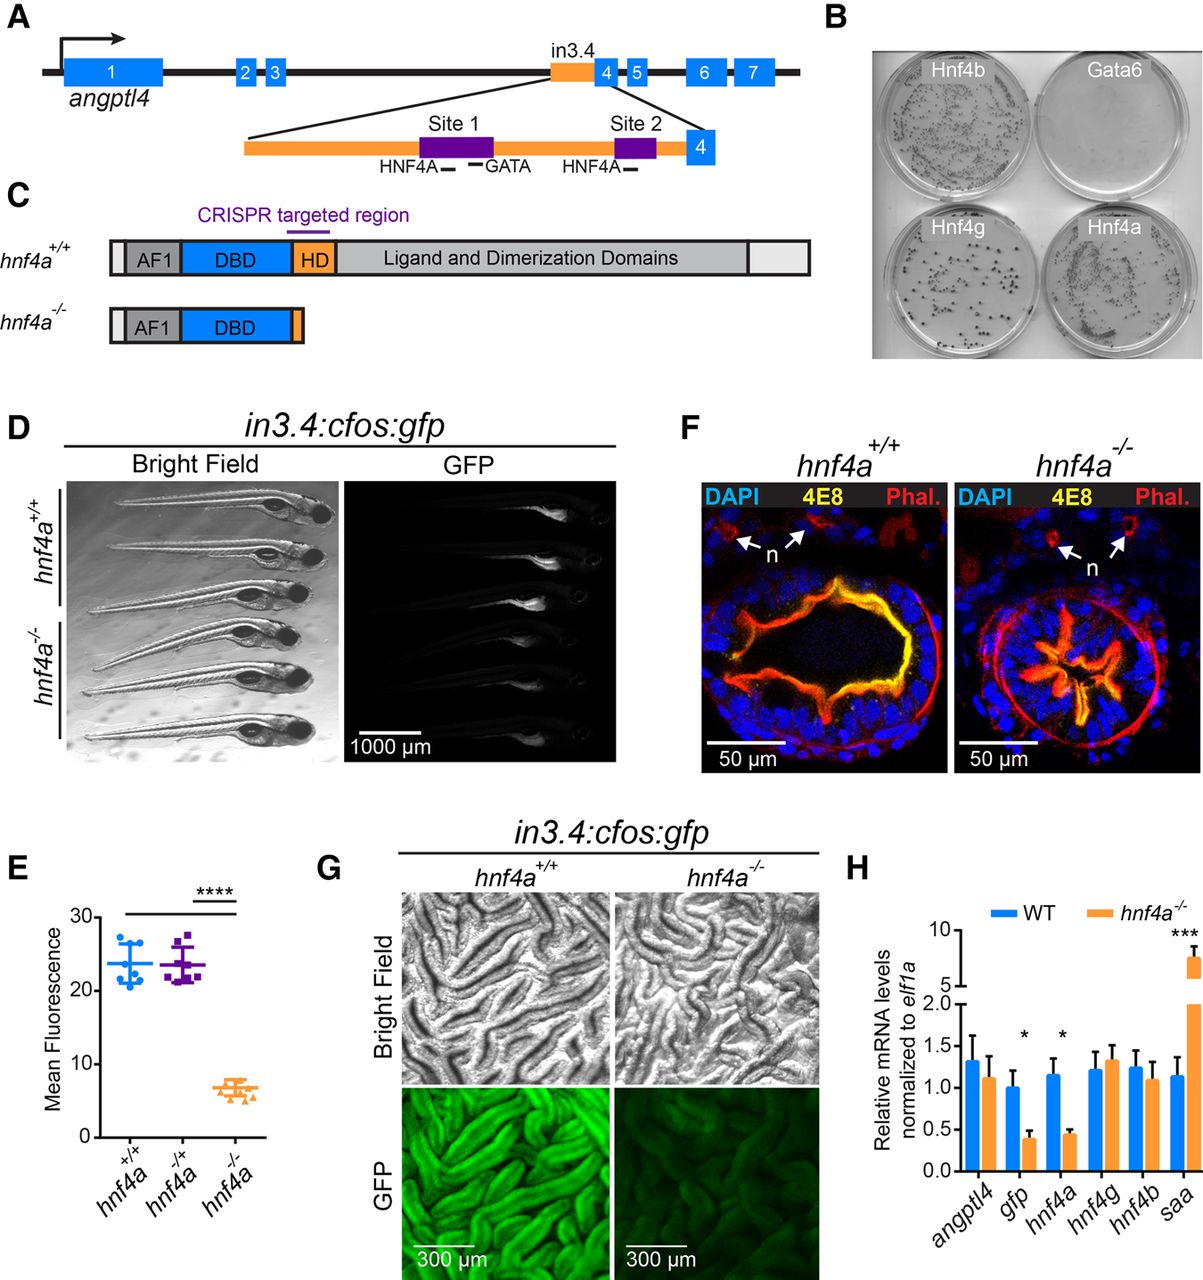
Zebrafish hnf4a is required for robust in3.4:cfos:gfp activity. (A) Schematic of the microbiota-suppressed zebrafish enhancer, in3.4, highlighting the regions required for intestinal activity (purple) which both contain putative HNF4 binding sites (Site 1 and Site 2) (Camp et al. 2012). (B) Image of four plates from the Y1H assay showing the Hnf4 family of transcription factors capable of binding in3.4 and driving expression of the antibiotic resistance reporter gene. (C) Hnf4a+/+ and Hnf4a?/? protein cartoons showing the DNA binding domain (DBD) and hinge domain (HD). We characterized the two with the largest lesions, a ?43 bp deletion in the hinge domain (allele designation rdu14) and a +25 bp insertion in the hinge domain (allele designation rdu15), which both result in frame-shift and early stop codons and significantly reduced transcript. (D) Stereofluorescence GFP and bright-field microscopy showing representative hnf4a+/+ (top 3) and hnf4a?/? (bottom 3) 6dpf in3.4:cfos:gfp zebrafish. Genotype was blinded, and samples were arranged by intensity of GFP fluorescence. (E) GFP fluorescence (mean ± SEM) in hnf4a+/+ (n = 8), hnf4a+/? (n = 8), and hnf4a?/? (n = 8) 6-dpf in3.4:cfos:gfp zebrafish (Two-tailed t-test: t = 17.84, 16.51, respectively, df = 14, and [****] P < 0.0001). (F) Confocal microscopy showing representative axial cross sections in 6-dpf hnf4a+/+ (n = 4) and hnf4a?43/?43 (n = 4) larval zebrafish. 4E8 antibody (yellow) labels the intestinal brush border, DAPI (blue), and phalloidin (red), and nephros (n). (G) Bright-field microscopy (top) and stereofluorescence GFP (bottom) for representative hnf4a+/+ (n = 3) (left) and hnf4a?/? (n = 3) (right) dissected intestinal folds from adult in3.4:cfos:gfp zebrafish. (H) Relative mRNA levels (mean ± SEM) in hnf4a+/+ (n = 3) and hnf4a?/? (n = 3) adult zebrafish intestinal epithelial cell as measured by qRT-PCR. Two-tailed t-test: t = 0.93, 5.22, 6.56, 10.65, 0.75, 0.94, respectively, df = 4, and (*) P < 0.05, (***) P < 0.001. See also Supplemental Figures S1 and S2.

