
|
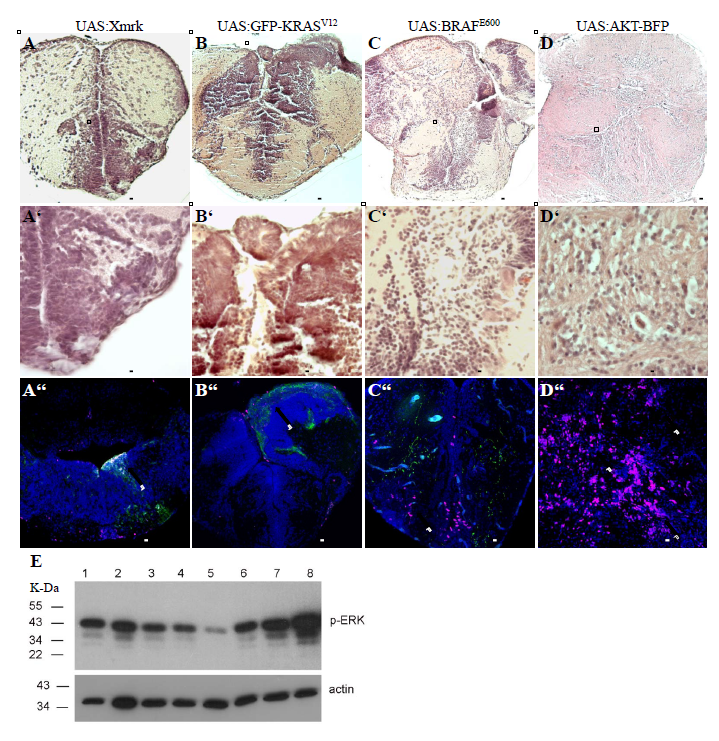
Fig. S2
Tumours can be induced by different oncogenes. A-D) H&E staining of lesions induced by somatic expression of different oncogenes. Boxed area indicates enlargement shown in A'-D', respectively. A''-D'') Immunostaining for BrdU of lesions induced by somatic expression of different oncogenes. Arrows point at lesions. E) Western blot showing the levels of phosphorylated ERK (P-ERK) and actin in control brain (lane 1), heterotopia (lane 2), zic:EGFRVIIIsomatic (lane 3), zic:Xmrksomatic (lane 4), zic:AKT-BFPsomatic (lane 5), zic:BRAFME600 somatic (lane 6), zic:GFP-KRASV12 somatic (lane 7) and zic:GFP-HRASV12 somatic (lane 8). Scale bars: A-C = 100 μm; D = 1 mm; A'-D' = 50 μm; A''-D'' = 100 μm.