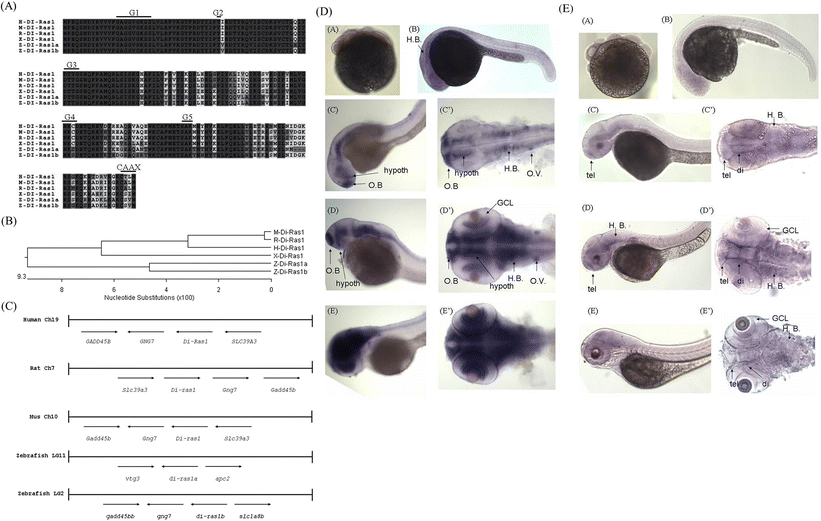
Fig. 1
Protein sequence alignments, phylogenetic tree, and expression patterns of zebrafish diras1a and diras1b. a Multiple alignments of diras1a and diras1b amino acid sequences were compared with those of human (H-DI-Ras1), mouse (M-DI-Ras1), rat (R-DI-Ras1), and Xenopus (X-DI-Ras1). The DIRAS1 sequences from the five species were aligned using ClustalW. Identical sequences are shaded in yellow, whereas residue similarities of the four DIRAS1 proteins are presented in cyan. b A phylogenetic tree was constructed based on the multiple alignments of the DIRAS1 proteins using MegAlign in DNASTAR through the neighbor-joining method. Scale bars indicate nucleotide substitutions (100×). c A graphical representation of the conserved synteny of the DIRAS1 gene clusters in human chromosome 19, rat chromosome 7, mouse chromosome 10, and zebrafish linking group (LG) 2. The diras1a gene is localized in LG 11. Ch denotes the chromosome. Whole mount in situ hybridization was performed using antisense riboprobes against diras1a (d) and diras1b (e) at the indicated developmental stages. The stages of embryonic development are indicated in the right (d, e). di diencephalon, GCL ganglion cell layer, H.B. hindbrain, and tel telencephalon. Stages are indicated in the upper right

