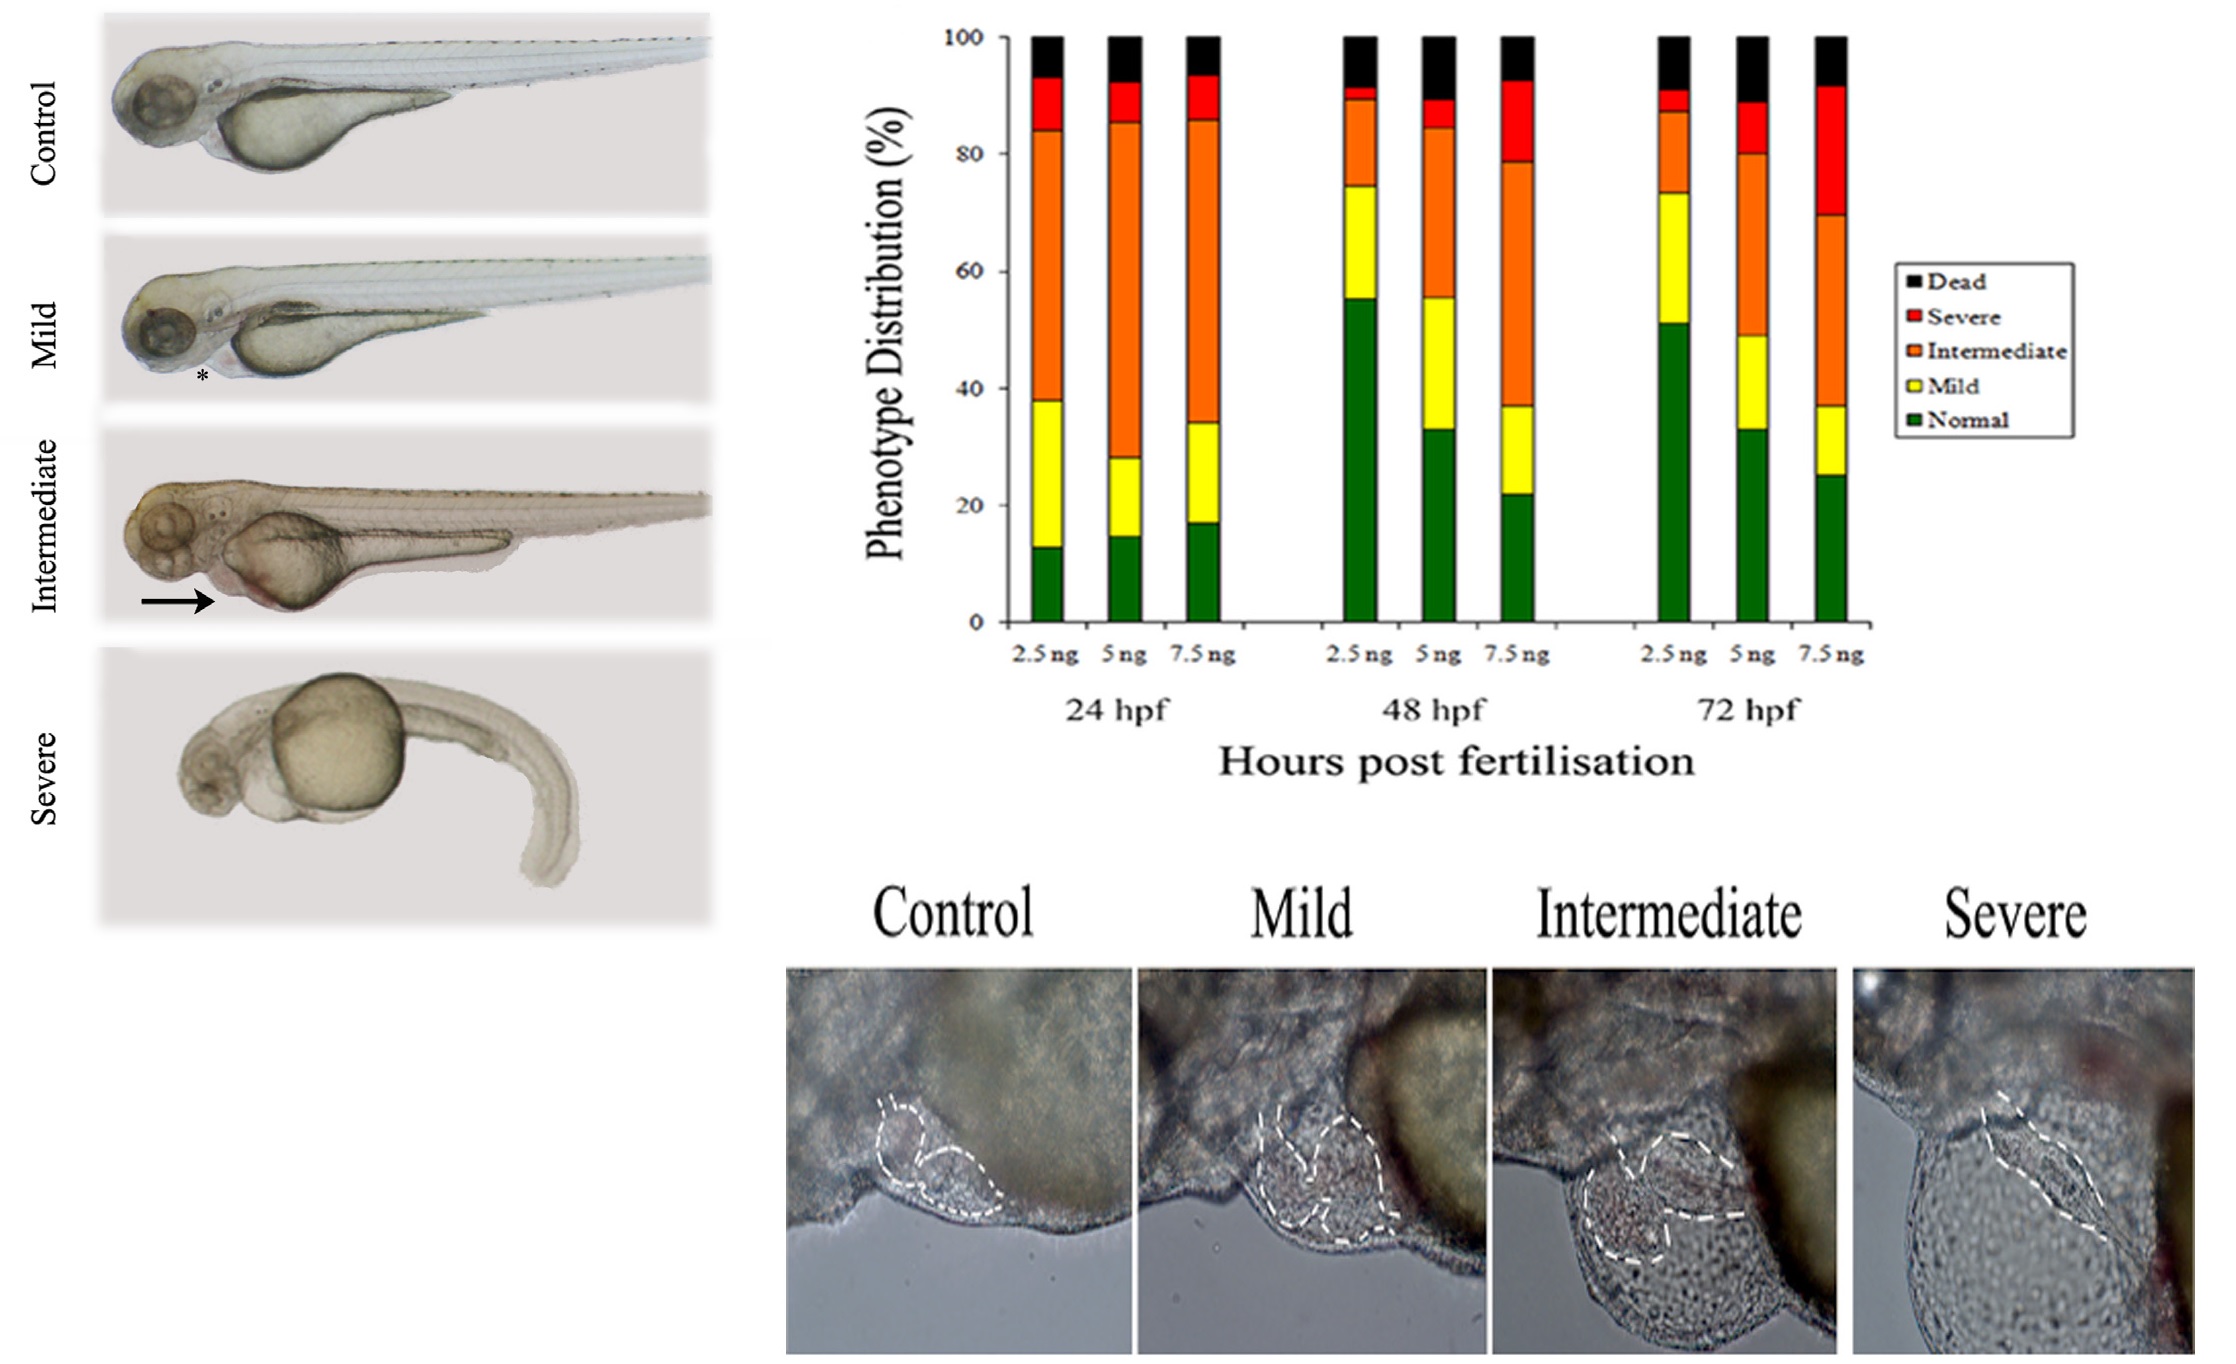
Fig. 1
Effects of plakophilin 2 knockdown on zebrafish development. 5 ng control 5 bp mismatch morpholino (A) or plakophilin 2 morpholino (B,C,D), were injected into embryos at the 1- cell stage. Phenotypes were observed at 72 hpf. (B) Mildly affected morphant embryos displayed pericardial oedema (asterisk) compared to controls. Morphant embryos in the intermediate category (C) exhibited oedema coupled with blood pooling on the yolk (arrow). (D) Severely affected morphants showed increased cardiac oedema, blood pooling and a kinked tail. (E) Either 2.5 ng, 5 ng or 7.5 ng of plakophilin 2 morpholino were injected into embryos at the 1-cell stage. The resulting morphant phenotypes were scored at 24-, 48- and 72 hpf. The distribution of the four classifications of phenotypes - normal (green), mild (yellow), intermediate (orange), severe (red) and dead (black) - is given in percentages. An average of 60 embryos were injected per experiment, n=3 separate experiments. (F-I) Lateral view of 5 ng plakophilin 2 morphant embryo hearts at 72 hpf with anterior to the left and dorsal to the top. (F) Control-injected embryos were normal; morphant phenotypes ranged from (G) mildly affected to (H) intermediate to (I) severely affected. Outline of heart shape is indicated in each phenotype.

