
|
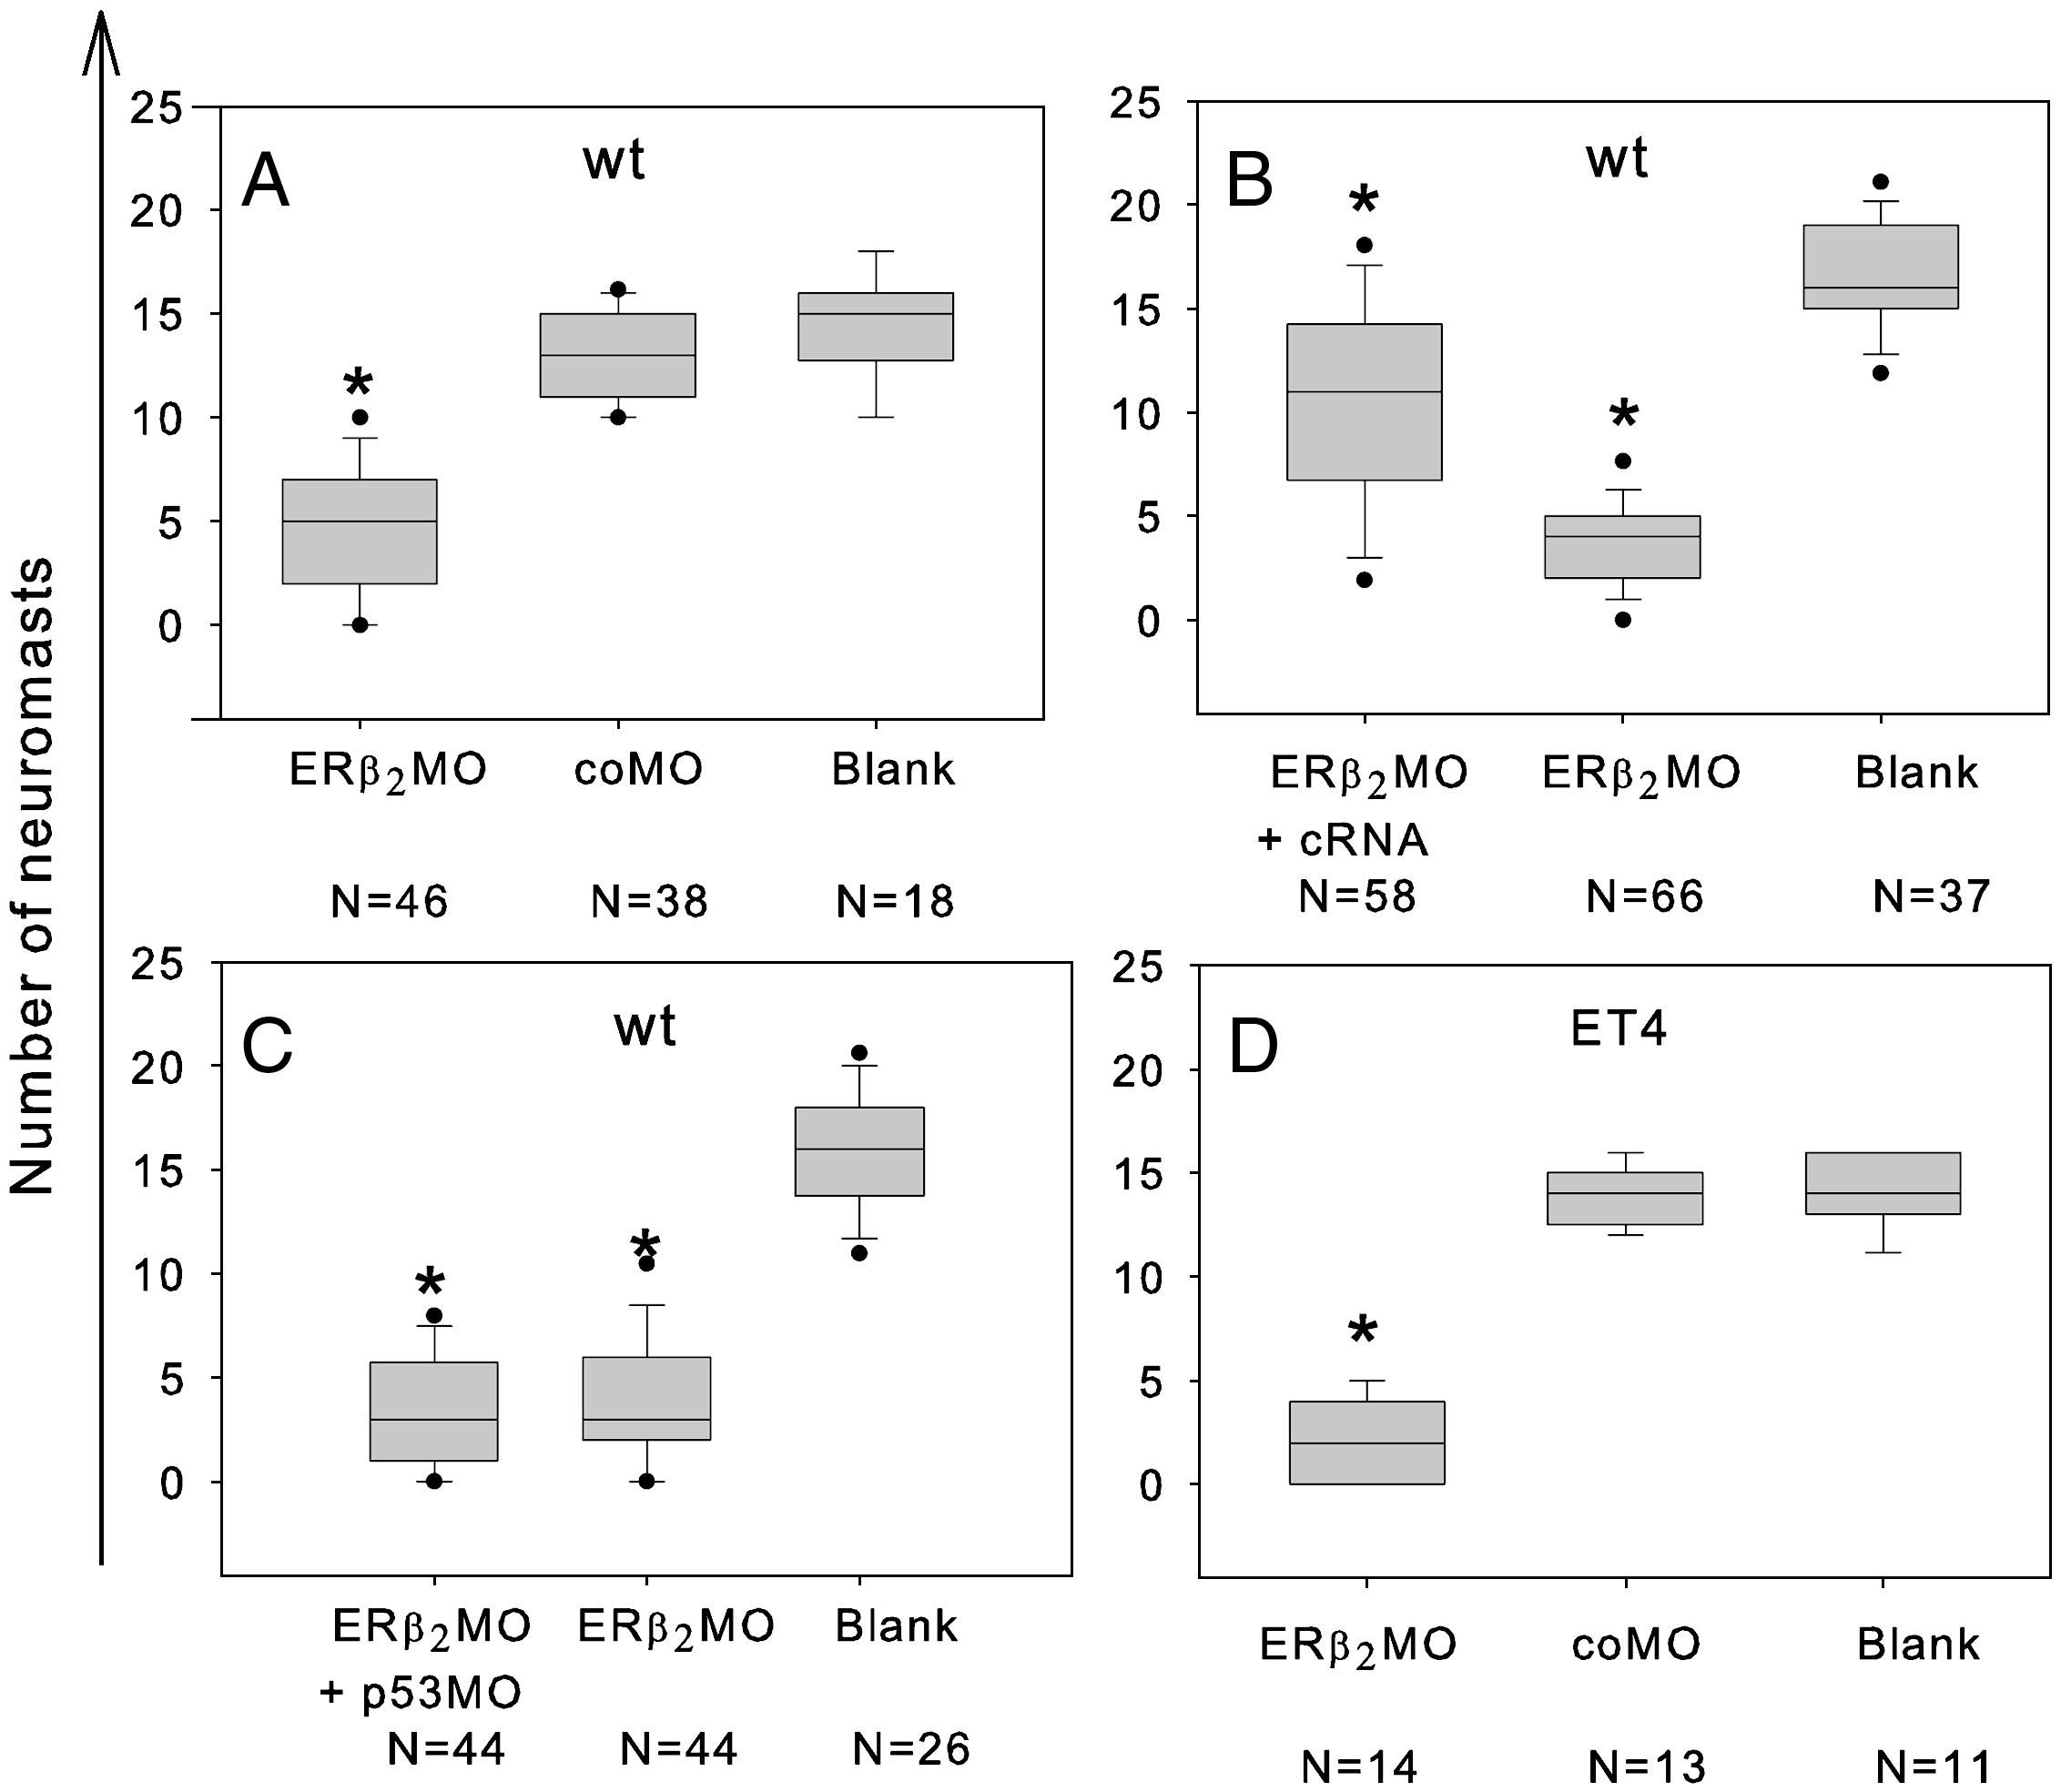
Fig. 4
Number of neuromasts assessed using live staining (FM1-43) in wild-type (A-C) at 72 hpf and with GFP visualisation in transgenic line (ET4) (D). The boxes symbolize the interquartile space of each distribution; the median is indicated with a horizontal line within the box, and dots indicate extreme values (5th/95th percentile). The number of individuals recorded for elaboration of the box plots is indicated with N = number of individuals. Numbers of neuromasts are shown in (A) ERβ2 MO- or coMO-injected wild-type larvae (both MOs at 15 �M); (B) ERβ2 MO-injected wild-type larvae (15 �M) co-injected with cRNA (300 ng); (C) ERβ2 MO-injected wild-type larvae co-injected with p53MO (both at 15 �M). (D) ET4 larvae injected with ERβ2 MO or coMO (both at 15 �M). One-way ANOVA following the Tukey test were performed to test the differences between blank (uninjected) and injected embryos and significances were indicated with * when p ≤ 0.05.
Reprinted from Developmental Biology, 330(1), Froehlicher, M., Liedtke, A., Groh, K., Lopez-Schier, H., Neuhauss, S.C., Segner, H., and Eggen, R.I., Estrogen receptor subtype beta2 is involved in neuromast development in zebrafish (Danio rerio) larvae, 32-43, Copyright (2009) with permission from Elsevier. Full text @ Dev. Biol.